Thesis
In assessing the investment potential of AT&T, Inc. (NYSE:T), a comprehensive analysis using three distinct Discounted Cash Flow [DCF] scenarios reveals a compelling narrative. These scenarios, spanning from optimistic growth to more conservative projections, highlight the considerable upside potential of AT&T’s stock. With the most bullish DCF model indicating a striking 332.6% upside from the current stock price, and even the most conservative projection suggesting a substantial 138.6%% potential gain, this article explores the nuances of these valuations and provides valuable insights into the company’s financial health, risks, and the reasons why AT&T may stand as an attractive investment option, especially when compared to its competitors, for those reasons I rate AT&T as “strong buy”.
Overview
Strengths
Perhaps its most significant and crucial strength lies in its ability to defend against potential newcomers in the communications sector. For instance, when Google Fiber entered the market, offering 1 Gbps internet, AT&T responded by offering speeds of up to 5 Gbps and lowering prices, which made Google’s expansion less profitable. This is why, in 2016, all of Google Fiber’s expansion plans were put on hold.
Another aspect I admire about AT&T is its operations in Mexico and Canada. In my opinion, especially with respect to Mexico, this provides a significant catalyst for AT&T to offset any potential decline in its US business. Mexico boasts a population of 126 million people, and AT&T is not as dominant a player there, which means it can more easily capture market share from its competitors.
Flaws
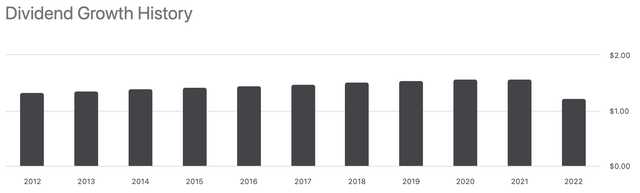
One of its most significant flaws is its classification as a dividend stock. This has led the management to prioritize rewarding shareholders, often through increasing dividends while debt was increasing.
Seeking Alpha
Another concern is the market in which AT&T operates, which is already saturated, akin to the railway industry. It’s analogous to someone attempting to build a cargo railway in the US today. AT&T’s economic moat makes it susceptible to price wars that can erode its profitability. Therefore, enhancing efficiency becomes a crucial aspect to address.
Why its revenue has been declining
The first reason is the decline of Pay-TV in favor of streaming services. This is the primary driver behind AT&T’s desire to either sell its 70% stake in DirectTV or merge it with Dish.
In the most recent quarter, DirectTV witnessed a reduction in its customer base, losing approximately 400,000 customers and reducing the total customer count to 12.4 million. When the venture was established in 2021, DirectTV had more than 15 million customers. This decline has resulted in a reduction in the cash flow that AT&T receives from this venture, decreasing from $2.7 billion to $1.9 billion.
In my opinion, this move would be beneficial for AT&T as it would help alleviate its debt burden while allowing it to exit a declining market.
Statista
The second reason is the decrease in legacy voice revenues. Legacy voice involves connecting traditional telephony devices to a unified network. The cause of this decline is the rise of Over-the-Top [OTT] voice services, which essentially allow mobile users to make calls over data networks. This decline has had a more significant impact on businesses, in my opinion, possibly due to the vulnerability that legacy voice systems represent to data breaches.
Financials
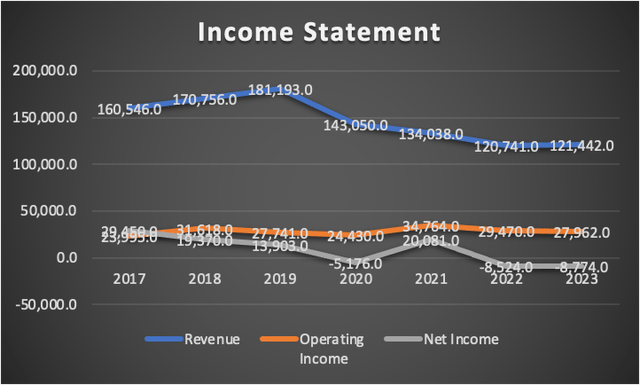
When we examine AT&T’s income statement, the first noticeable trend is a decline in revenue, which can be attributed to several factors. The primary factors include:
- A sharp decrease in international roaming during 2020 was expected due to obvious reasons.
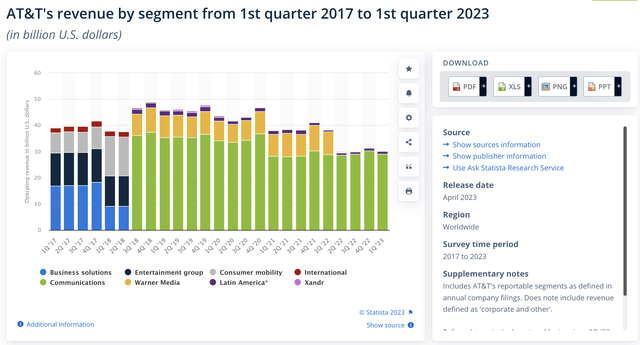
- A decline in domestic video and legacy wireline services. This decline in legacy services is a continuing trend and has already been established. However, it’s worth noting that the spinoff of Warner Media also contributed to this, as you can see in the table provided in the “Overview” section.
Author’s Calculations
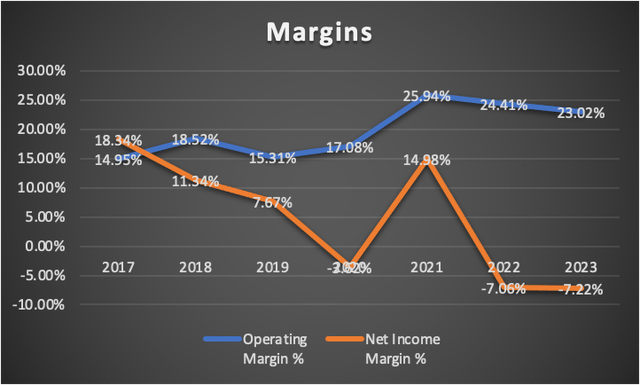
Despite the challenges, AT&T managed to control its expenses and boost its operating margin to 25% in 2021, which has since stabilized at around 23%. However, the net income margin tells a different story, currently standing at a negative -7.2%.
Author’s Calculations
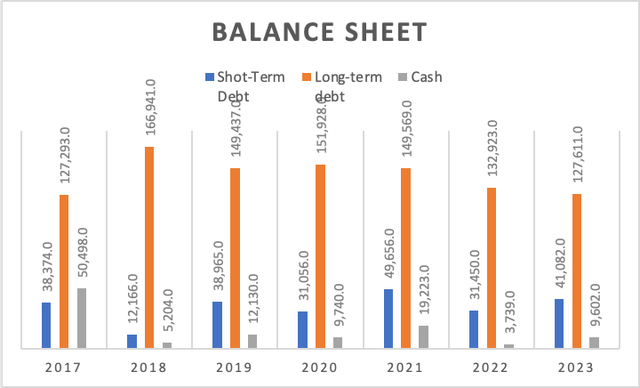
While the balance sheet isn’t particularly strong, it does indicate significant progress in debt management since 2018. Long-term debt, which peaked at $166.9 billion, has now reduced to $127.6 billion, marking a 33% decrease. As I previously mentioned in my article about Verizon Communications, Inc. (VZ), this could be a strategic choice made by the management.
Author’s Calculations
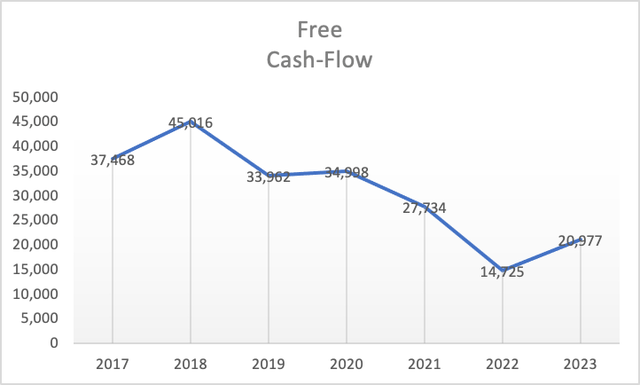
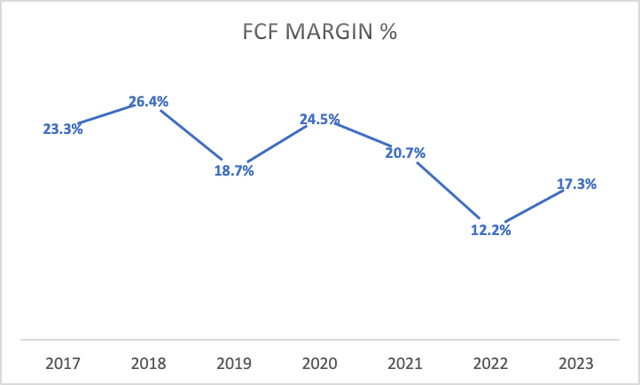
Now, turning to an important aspect: Free Cash Flow. AT&T doesn’t excel in this area, as evidenced by the declining cash flow over time. Similarly, the FCF margin has decreased over time. However, there has been a recent improvement, with the margin increasing from 12.2% to 17.3% from 2022 to the present. This indicates an effort to cut costs, but the sustainability of this margin remains uncertain.
Author’s Calculations
Author’s Calculations
In summary, AT&T’s financial condition is somewhat challenging, but there have been improvements. However, it’s worth noting that the company’s overall assets have decreased because of the divestitures, and the dividend payout doesn’t cover the situation by itself.
Valuation
Assumptions
To evaluate AT&T, I have conducted three different DCF models, each based on different revenue growth scenarios. These scenarios are as follows:
- Maintaining the revenue growth that analysts expect in the period 2023-2024, which is approximately 1.67%.
- Assuming a more conservative scenario with a revenue growth rate of 0.54%, similar to what Verizon is expected to deliver in the long term.
- Considering a more pessimistic scenario where AT&T’s revenue shrinks at a rate of -9.94%, in line with the forward revenue growth rate expected for AT&T.
Below, you will find a table of assumptions that incorporates all the current data for AT&T, based on a trailing twelve-month [TTM] basis.
| TABLE OF ASSUMPTIONS | |
| (Current data) | |
| Assumptions Part 1 | |
| Equity Value | 101,903.00 |
| Debt Value | 168,693.00 |
| Cost of Debt | 3.73% |
| Tax Rate | 40.00% |
| 10y Treasury | 4.80% |
| Beta | 0.67 |
| Market Return | 10.50% |
| Cost of Equity | 8.62% |
| Assumptions Part 2 | |
| EBIT | |
| Tax | 3,548.00 |
| D&A | 14,193.50 |
| CapEx | 18,755.00 |
| Capex Margin | 13.50% |
| Assumption Part 3 | |
| Net Income | -8,774.00 |
| Interest | 6,296.00 |
| Tax | 3,548.00 |
| D&A | 15,284.00 |
| EBITDA | 16,354.00 |
| D&A Margin | 12.59% |
| Interest Expense Margin | 5.18% |
| Revenue | 121,442.0 |
As depicted in this table, which serves as the basis for calculating the WACC, both Depreciation & Amortization (D&A) and interest expenses are calculated as a percentage of revenue. Specifically, D&A is set at 12.59%, and interest expenses are at 5.18%. This approach provides a clearer view of how AT&T’s financials would be impacted as the company grows its revenue.
It’s essential to clarify that AT&T has been actively reducing its debt load, leading to lower interest expenses. By assuming an increase in debt, as I have done in these DCF models, I acknowledge that this could impact the downside scenario while potentially improving the upside scenarios. This adjustment accounts for the possibility that AT&T might pay less in interest expenses.
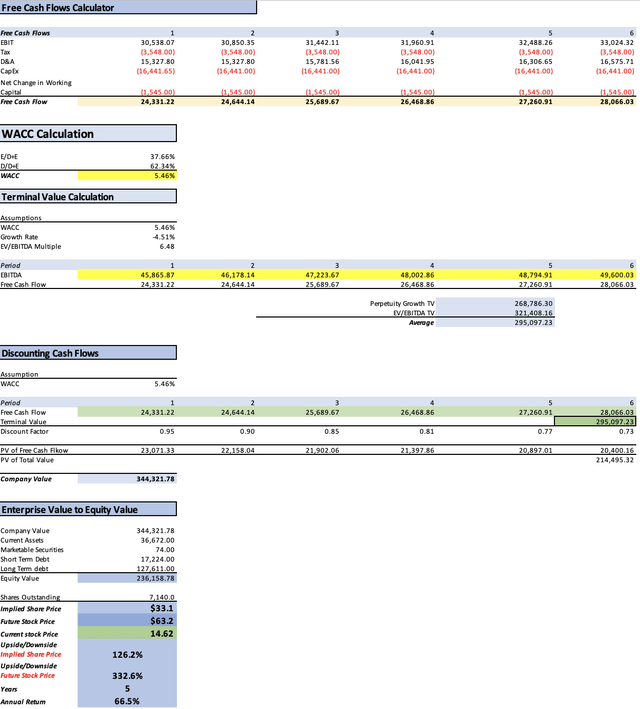
Scenario 1 – 1.67% Revenue Growth Rate
In this initial model, as indicated by the subtitle, the revenue growth rate is set at 1.67%. This rate aligns with analysts’ expectations for revenue growth from 2023 to 2024. As previously mentioned, both Depreciation & Amortization (D&A) and Interest are calculated as percentages tied to revenue.
| Revenue | Operating Income | Plus D&A | Plus Interest | |
| 2023 | $121,790.0 | $24,224.03 | $39,551.83 | $45,865.87 |
| 2024 | $123,360.0 | $24,536.30 | $39,864.10 | $46,178.14 |
| 2025 | $125,395.4 | $24,941.15 | $40,722.71 | $47,223.67 |
| 2026 | $127,464.5 | $25,352.68 | $41,394.64 | $48,002.86 |
| 2027 | $129,567.6 | $25,771.00 | $42,077.65 | $48,794.91 |
| 2028 | $131,705.5 | $26,196.22 | $42,771.93 | $49,600.03 |
| ^Final EBITA^ |
| D&A Projection | Interest Projection | |
| 2023 | 15,327.797 | 6,314.04 |
| 2024 | 15,327.797 | 6,314.04 |
| 2025 | 15,781.557 | 6,500.96 |
| 2026 | 16,041.953 | 6,608.23 |
| 2027 | 16,306.645 | 6,717.26 |
| 2028 | 16,575.705 | 6,828.10 |
Author’s Calculations
This DCF analysis results in a present fair value of $33.1, which represents a substantial 126.2% increase over the current stock price of $14.62. Consequently, the projected future price of $63.20 implies an impressive 332.6% upside from the current stock price.
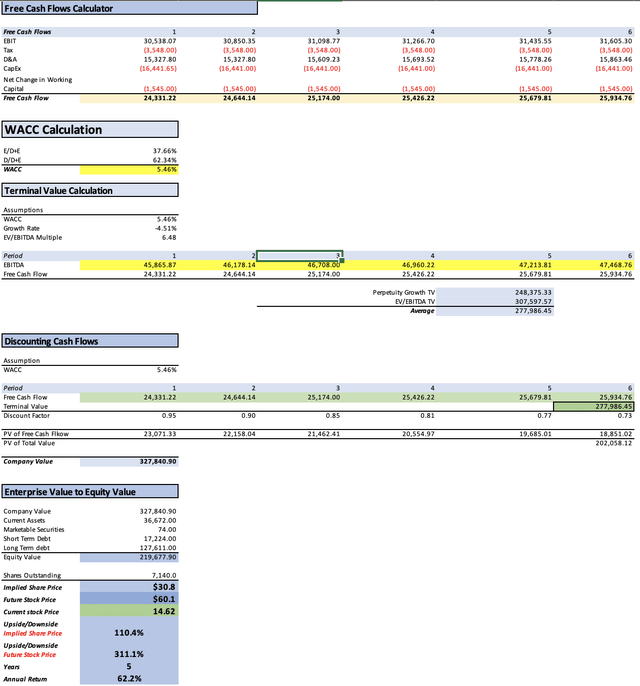
Scenario 2 – 0.54% Revenue Growth Rate
In this second scenario, I am adjusting the revenue growth rate to a more conservative 0.54%, which is almost in line with the 0.53% growth expected for Verizon.
| Revenue | Operating Income | Plus D&A | Plus Interest | |
| 2023 | $121,790.0 | $24,224.03 | $39,551.83 | $45,865.87 |
| 2024 | $123,360.0 | $24,536.30 | $39,864.10 | $46,178.14 |
| 2025 | $124,026.1 | $24,668.80 | $40,278.03 | $46,708.00 |
| 2026 | $124,695.9 | $24,802.01 | $40,495.53 | $46,960.22 |
| 2027 | $125,369.2 | $24,935.94 | $40,714.20 | $47,213.81 |
| 2028 | $126,046.2 | $25,070.60 | $40,934.06 | $47,468.76 |
| ^Final EBITA^ |
| D&A Projection | Interest Projection | |
| 2023 | 15,327.797 | 6,314.04 |
| 2024 | 15,327.797 | 6,314.04 |
| 2025 | 15,609.226 | 6,429.97 |
| 2026 | 15,693.515 | 6,464.69 |
| 2027 | 15,778.260 | 6,499.60 |
| 2028 | 15,863.463 | 6,534.70 |
Author’s Calculations
This DCF analysis results in a present fair value of $30.80, representing a substantial 110.4% increase over the current stock price of $14.62. Consequently, the projected future price of $60.10 implies a noteworthy 311.1% upside from the current stock price.
Scenario 3 – 9.94% revenue growth rate
This final scenario represents the most challenging outlook, involving a substantial 9.94% decline in revenue. This decline can be primarily attributed to the factors previously mentioned, including the growth of streaming services and the abandonment of fixed phone networks.
| Revenue | Operating Income | Plus D&A | Plus Interest | |
| 2023 | $121,790.0 | $24,224.03 | $39,551.83 | $45,865.87 |
| 2024 | $123,360.0 | $24,536.30 | $39,864.10 | $46,178.14 |
| 2025 | $111,098.0 | $22,097.40 | $36,079.56 | $41,839.29 |
| 2026 | $100,054.9 | $19,900.91 | $32,493.25 | $37,680.46 |
| 2027 | $90,109.4 | $17,922.76 | $29,263.42 | $33,935.03 |
| 2028 | $81,152.5 | $16,141.24 | $26,354.64 | $30,561.88 |
|
^Final EBITA^ |
| D&A Projection | Interest Projection | |
| 2023 | 15,327.797 | 6,314.04 |
| 2024 | 15,327.797 | 6,314.04 |
| 2025 | 13,982.165 | 5,759.73 |
| 2026 | 12,592.338 | 5,187.21 |
| 2027 | 11,340.659 | 4,671.60 |
| 2028 | 10,213.398 | 4,207.25 |

Author’s Calculations
In this DCF analysis, the present fair value is estimated at $12.20, which is 16.8% lower than the current stock price of $14.62. However, it’s noteworthy that the projected future price of $34.90 still implies a notable 138.6% upside from the current stock price.
It’s important to recognize that this scenario reflects the current situation, as the current stock price is relatively close to the fair value indicated by this DCF analysis. Additionally, as previously mentioned, if AT&T continues to reduce its debt load, interest payments will likely decrease, leading to higher cash flows. Such an adjustment would result in higher price targets and a smaller downside than the one implied here.
Risks to Thesis
Firstly, there’s the possibility of the operating margin falling below the average for the period 2017-2023, which I’ve utilized as a benchmark, standing at 19.89%. This figure is lower than the trailing twelve-month [TTM] margin of 23.02%. If this scenario unfolds, it could result in a more significant downside in the third scenario. However, it’s important to note that not reflecting AT&T’s decreasing debt load may mitigate this risk.
The second risk pertains to the potential of a dividend reduction. Investors currently regard AT&T as an income-oriented investment rather than a growth or value play. Should AT&T significantly cut its dividend, say by 30%, it could negatively impact the stock’s performance. On the flip side, such a move would free up cash flows that could enhance the stock’s valuation. Whether this is accepted by investors depends on their willingness to overlook the dividend cut. Alternatively, if AT&T redirected its entire dividend allocation towards debt reduction, it could be a more beneficial approach, liberating approximately $8 billion in cash flow. It’s important to remember that what holds value in a company is its free cash flows. Even if a company doesn’t pay dividends, increasing free cash flows means that, if desired, the company could do so.
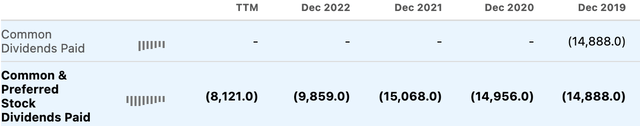
Dividend Expense (Seeking Alpha)
The third and final risk is AT&T’s substantial competitive advantage or moat. One might recall how AT&T responded when challenged by Google Fiber. Nevertheless, the saturated nature of this sector makes it less attractive for potential competitors, regardless of their capitalization. Nevertheless, there is always the risk of a competitor attempting to absorb these losses.
In conclusion, let me explain why I consider AT&T a better investment option compared to Verizon. In a previous article, I mentioned that Verizon might face declining revenue with a high debt load. Consequently, they may need to sell assets, pay down debt, and potentially cut dividends. However, AT&T has already taken these steps, and its current financial situation appears stable, with cash flows surpassing those of Verizon. This makes AT&T a more secure choice when comparing the two.
Conclusion
In evaluating AT&T’s financial prospects, I’ve considered three distinct scenarios, each offering a unique perspective on the company’s potential trajectory. The first scenario, based on a revenue growth rate of 1.67%, paints a rosy picture with a present fair value of $33.10, representing a remarkable 126.2% increase over the current stock price of $14.62. This optimistic outlook underscores AT&T’s potential if it maintains its growth trajectory, although it does not fully account for its debt reduction efforts. The second scenario, with a more modest revenue growth rate of 0.54%, mirrors the conservative expectations set for long-term growth, similar to Verizon. Here, the DCF analysis yields a present fair value of $30.80, still resulting in a substantial 110.4% upside from the current stock price. However, it emphasizes the need for caution amid a slower growth environment. Lastly, the third scenario, reflecting a 9.94% revenue decline, serves as a stark reminder of the challenges AT&T faces in a rapidly evolving telecommunications landscape. With a present fair value of $12.20, it’s 16.8% lower than the current stock price, indicating a potential downside. Nevertheless, it remains a realistic scenario considering market dynamics, and it hints at the importance of debt management.
When comparing AT&T to Verizon, the choice becomes more apparent. AT&T has already undertaken strategic steps, such as debt reduction and asset reallocation, which have contributed to a more stable financial situation with larger cash flows than Verizon. While there are risks, particularly in terms of dividend cuts and potential margin decline, AT&T appears to be in a more advantageous position.
Read the full article here