GlobalFoundries (NASDAQ:GFS) has lost steam after a strong start in 2023. The stock managed to gain up to 34.5% by mid-February, only to lose it all and then some by late August. However, an argument can be made that the stock is worth taking into consideration due to a couple of reasons. Some though may object to this for their own reasons. Why will be covered next.
Why GFS Is worth a look after the recent slide
GFS is one of the top players in the foundry industry, but, unlike the other four out of the top five foundries, GFS is not from East Asia. While GFS does have a substantial presence in East Asia, it is regarded as a U.S. company as a spin-off from Advanced Micro Devices (AMD). GFS is therefore seen as a beneficiary of ongoing efforts to increase U.S. manufacturing of semiconductor chips, including through initiatives like the U.S. Chips and Science Act.
GFS has its advantages over others, but a previous article from March rated GFS a hold due to various issues, including multiples that were much higher and a significantly worse track record when it comes to growth compared to other leading foundries. This might have seemed misplaced with the stock in the midst of a strong rally at that time, but it turned out to be warranted because the stock has since given back its gains from early 2023.
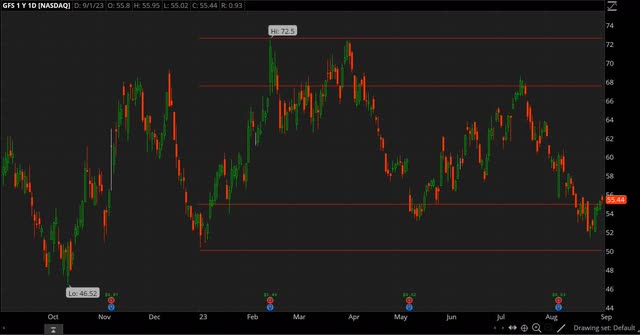
Source: Thinkorswim app
The chart above shows how the stock’s YTD gains have whittled down to just 2.9% after being up as much as 34.5% in early 2023. However, the chart also shows something else. The stock retreated, but it bounced once it got to the $50-55 region in late August, which is similar to what happened twice before in 2023. Note how the stock reversed its decline in January and May once it got to the $50-55 region, an indication support is present in this region.
In addition, there seems to be resistance in the $67.50-72.50 region because the stock reversed course in this region on multiple occasions. The 2023 highs are all in this region, including the February 2023 high of $72.50, the March 2023 high of $72.34 and the April 2023 high of $72.37. For a stock to top out in roughly the same price region is unlikely to be a mere coincidence. It’s more likely to be caused by resistance.
Similarly, for a stock to bottom in the same price region is not likely to be due to coincidence, but more likely to be due to support. If we then assume that there is support in the $50-55 region and resistance in the $67.50-72.50 region, then an argument can be made that GFS is a buy with the stock close to support and assuming the stock will continue to stay within the trading range it has been in for basically all of 2023.
Why some may be reluctant to back long GFS
GFS has been around as an independent entity for over 14 years, but it spent many years as a privately held company, before being relisted again in October 2021. As a result, there are only a couple of years of detailed financial data available for GFS. Nevertheless, EPS has made big strides in the last three years, thanks in no small part to the boom in semiconductor demand in the last couple of years.
In FY2022, GFS posted adjusted diluted earnings per share of $3.11, much better than the loss of $2.69 two years earlier in FY2020. However, the semiconductor boom has ended and semiconductor demand has fallen, which has pressured earnings in the short term. Still, earnings are expected to grow as GFS is projecting revenue to grow in the 8-12% range in the long term. GFS also expects adjusted gross margin to improve from 28.4% in FY2022 to about 40%.
GFS has earned $2.67 on a TTM basis and if EPS grows by 26-27% on average in the next 5 years based on the guidelines from GFS, then it can be argued that a fair value for GFS would be around $72, well above the closing price of $55.44 as of September 1. It also helps explain why the stock has topped out in the $67.50-72.50 region in 2023 as mentioned earlier. Nevertheless, despite the above, some may still be reluctant to be long GFS for a few reasons.
For starters, while GFS has done much better in the last three years when it comes to growth, its track record over the last 14 years leaves much to be desired. In many ways, the gap between GFS and competitors like TSMC (TSM) and United MicroElectronics (UMC) has widened. A premium for GFS can be justified if it grows faster than competitors and while some believe that is possible, the past suggests some skepticism is warranted.
It’s possible GFS will do better than it has in the past, especially with the aid of initiatives like the Chips Act, but some will undoubtedly have reservations about GFS, especially since GFS trades at much higher multiples than other foundries like TSM and UMC as shown below. GFS, for instance, has a much higher market cap than UMC despite the latter being more profitable with higher margins.
|
GFS |
UMC |
TSM |
|
|
Market cap |
$30.64B |
$18.01B |
$445.38B |
|
Enterprise value |
$30.17B |
$14.41B |
$429.17B |
|
Revenue (“ttm”) |
$7,861.0M |
$8,142.9M |
$71,506.7M |
|
EBITDA |
$2,805.0M |
$3,940.4M |
$48,377.9M |
|
Trailing non-GAAP P/E |
17.54 |
7.21 |
15.38 |
|
Forward non-GAAP P/E |
26.69 |
9.91 |
18.85 |
|
P/S |
3.86 |
2.14 |
6.23 |
|
P/B |
2.91 |
1.72 |
4.35 |
|
EV/sales |
3.84 |
1.77 |
6.00 |
|
Trailing EV/EBITDA |
10.75 |
3.66 |
8.87 |
|
Forward EV/EBITDA |
11.13 |
4.68 |
9.64 |
Source: SeekingAlpha
The state of the foundry industry is on shaky grounds
There is another reason why some may be reluctant to place bets on GFS, or any other foundry for that matter. The foundry industry is facing a downturn after several years of expansion. Worse, the downturn has turned out to be worse than expected. GFS too has acknowledged that the downturn is proving to be more serious than anticipated. From the Q2 FY2023 earnings call:
“Similar to others in the industry, we believe that semiconductor inventory levels across several end markets are coming down more slowly than previously expected. Certain end markets that we service such as smart mobile devices, communications infrastructure and data center as well as the lower end of the consumer and home electronics markets are being impacted by a combination of increased inventory levels and lower year-over-year demand.
Consistent with the discussion in our first quarter update, we continue to believe that the return to more normalized inventory levels in the consumer-centric end markets is forecast to happen more slowly than previously anticipated and based on our discussions with our customers, will best occur towards the end of 2023.”
A transcript of the Q2 FY2023 earnings call can be found here.
The drop in demand has made its way back to the quarterly reports. The table below shows how earnings have gone down in recent quarters. Note that the increase in gross margin can be attributed to a change in product mix. Also keep in mind that the quarterly numbers tend to get stronger towards the end of the year due to seasonal factors, like the holiday season.
|
(Unit: $1M, except for EPS and margins) |
|||||
|
(IFRS) |
Q2 FY2023 |
Q1 FY2023 |
Q2 FY2022 |
QoQ |
YoY |
|
Revenue |
1,845 |
1,841 |
1,993 |
– |
(7%) |
|
Gross margin |
28.8% |
28.0% |
27.0% |
80bps |
180bps |
|
Operating margin |
14.9% |
15.8% |
14.9% |
(90bps) |
– |
|
Operating profit |
275 |
290 |
297 |
(5%) |
(7%) |
|
Net income |
237 |
254 |
264 |
(7%) |
(10%) |
|
EPS |
0.43 |
0.46 |
0.48 |
(7%) |
(10%) |
|
(Non-IFRS) |
|||||
|
Gross margin |
29.6% |
28.5% |
28.0% |
110bps |
160bps |
|
Adjusted EBITDA |
668 |
655 |
784 |
2% |
(15%) |
|
Adjusted operating margin |
18.3% |
17.7% |
17.6% |
60bps |
70bps |
|
Adjusted operating profit |
338 |
326 |
350 |
4% |
(3%) |
|
Adjusted Net income |
297 |
290 |
317 |
2% |
(6%) |
|
EPS |
0.53 |
0.52 |
0.58 |
2% |
(9%) |
Source: GFS Form 6-K
Guidance calls for the YoY decline to continue as shown below.
|
(IFRS) |
Q3 FY2023 (guidance) |
Q3 FY2022 |
YoY (midpoint) |
|
Revenue |
$1,825-1,870M |
$2,074M |
(11%) |
|
Gross margin |
27.4% |
29.4% |
(200bps) |
|
EPS |
$0.37-0.47 |
$0.61 |
(31%) |
|
(Non-IFRS) |
|||
|
Gross margin |
28.3% |
29.9% |
(160bps) |
|
EPS |
$0.46-0.54 |
$0.67 |
(25%) |
The FY2023 outlook sees revenue shrinking in the high single digits YoY, which is not that different from the 10% decline TSM is calling for in its latest forecast. GFS is thus estimated to earn about $2.08 on revenue of $7.4B in FY2023. In comparison, GFS earned $3.11 on revenue of $8.1B in FY2022.
“for the full year, we forecast that we expected revenue to decline in the in the mid- to high single digits. We still expect to be in that range. And with our first half results really now in the books and with our third quarter guidance, you can probably infer from that third quarter with the first half that we are expecting to be towards the high end of that year-over-year range.”
It’s worth mentioning that GFS has not steadily lowered its FY2023 outlook the way TSM and UMC have done throughout 2023. And while forecasts have been lowered, the general expectation is that the semiconductor market will return to growth in 2024. Still, the fact that the downturn in the foundry market is proving to be more persistent than anticipated should give people pause. Recent forecasts have not panned out, so one should probably have some reservations about the market returning to growth in 2024.
Investor takeaways
I am neutral on GFS. While there are arguments to be made in favor of long GFS, there are also arguments to be made as to why one should keep their distance. GFS is expected to grow faster than its peers due to being the beneficiary of various initiatives designed to increase U.S. manufacturing of semiconductor chips. GFS is actually in the midst of expanding its production capacity to be able to meet the expected growth in demand.
The charts suggests that if someone is looking for a good entry point, then now is a good time with the stock close to what appears to be support. The stock has shown a tendency to trade within a range for all of 2023, so one could open a position by betting that the stock, which is currently towards the lower end of the range, will make its way back to the upper end of the range.
However, while GFS trades at higher multiples than its closest competitors, GFS is not growing any faster to warrant the premium, at least as of right now. GFS expects FY2023 revenue to contract in the high single digits, which is similar to the decline TSM expects. GFS is assigned a premium based on expectations of faster growth in the coming years, and while GFS may still deliver on this promise in the coming years, GFS is not really delivering on the kind of growth expected.
Granted, the current downturn is playing a role. Still, while GFS has done well in the last three years, its track record, if one includes the preceding years, is mixed at best. Some might argue the many setbacks GFS has suffered in the past should not factor into decisions, but some may still be skeptical GFS will really grow as fast as some project it will. GFS will certainly find it difficult to grow if demand in the foundry market stays soft like it is right now.
Bottom line, there is an argument to be made for and against going long GFS. In the end, it probably comes down to whether ones believes GFS can grow much faster than other leading foundries in the coming years. Its previous track record suggests it won’t, but there is a saying that past performance is not indicative of future results. There is essentially no one size fits all when it comes to GFS. It all comes down to the individual to decide which argument carries the most weight.
Read the full article here