
Introduction
Rexford Industrial Realty, Inc. (NYSE:REXR) has a portfolio of 371 properties totaling approximately 45 million rentable square feet mostly located in Southern California’s infill markets. The exposure to Southern California’s infill region situates the company in a fragmented market characterized by high-entry barriers, scarce developable land with high concentrations of people, jobs and housing. The company benefits from proximity to the ports of Los Angeles and Long Beach, two of the busiest ports in the U.S. The underlying drivers of demand for industrial space include an expanding regional economy, growth in e-commerce transaction and delivery volumes, and the increased importance of last-mile facilities for timely fulfillment.
Source: Rexford Industrial Realty 10-K for 2022 and 10-Q for Q3 2023
In this article we evaluate Rexford’s business model and operating performance in light of the elevated interest rate environment. We first evaluate the historical relationship between the performance of the industrial REIT sector and interest rates as measured by the 10-year Treasury. We consider the implications of the current macro environment for industrial REITs in light of the historical relationship. We then infer the impact of the elevated levels of interest rates on Rexford’s business model. In particular, we consider the capitalization rate of recent transactions. We compare this rate with a forward estimate of the financing costs Rexford would have given their credit profile. Throughout the article, we connect quantitative metrics with salient features of Rexford’s business model and operating performance. At the end of the article, a recommendation is offered and a conclusion is presented.
Interest Rates and the Industrial REIT Sector
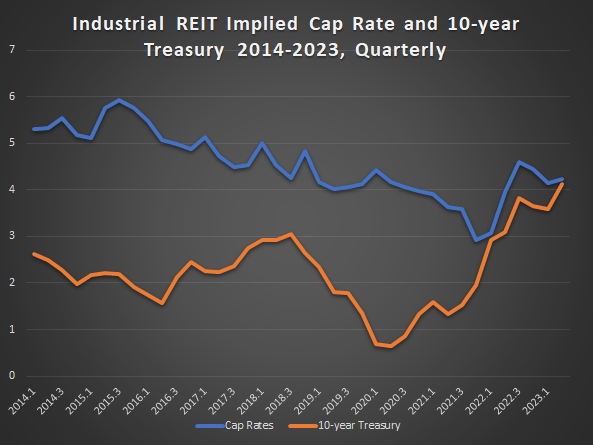
Please take a look at the chart below which presents the Industrial REIT sector’s implied capitalization rate, or cap rate, and the 10-year Treasury. The chart presents quarterly time periods from 2014 to Q2 2023. Rexford first offered their shares to the public in July 2013. The cap rate uses the net operating income (NOI) as the numerator, which is a frequently used proxy for cash flows generated by real estate assets. The denominator is an estimate of asset value.
Nareit T-Tracker for Q2 2023 and the Federal Reserve Bank of St. Louis
Source: Nareit T-tracker Q2, 2023 and FRED St. Louis
It is evident from the chart that there is a positive spread between the cap rates and the 10-year Treasury for the time period presented. The spread briefly narrowed sometime in 2018 and then widened, then started to narrow until it acutely narrowed from the end of 2021 up until the current period. If we look at only the 2014 to 2019 time period, the spread between the cap rate and the 10-year was 266 basis points on average. As of Q2 2023, which is the most recent data available from Nareit, that spread is only nine basis points. The current narrow spread dynamic has been referred to by several executives in various REITs and is among the reasons some REITs are facing an increasingly challenged environment executing transactions. The Federal Reserve has steadily increased interest rates at an unusually brisk pace and that hasn’t allowed cap rates to fully adjust to a correspondingly higher rate. We are in the middle of this adjustment. For cap rates to adjust, the numerator (NOI) would have to increase or the denominator (asset value) would have to come down. Sellers are hesitant to accept lower prices given that they have in their recent memory asset values that were elevated for an extended period. Some sellers might be hoping for a return to lower interest rates or perhaps for asset values to reach their high-water mark from a few years ago before selling.
The relationship between interest rates and cap rates can give us an idea of the relative valuation of a particular REIT sector. Let us now examine the impact of elevated interest rates on Rexford in particular.
Business Model and Competitive Advantage
A key part of Rexford’s competitive advantage is their management’s deep market experience and relationships that enable them to source off-market or lightly marketed properties for acquisition. They sometimes source transactions from sellers with generational ownership shifts, or that might be facing a liquidity event and lack economical refinancing options. They often consider properties that have curable functional obsolescence or that are operating below market occupancy. Real estate assets that have below market rent or have a near-term tenant rollover are well within the acquisition criteria of Rexford. These types of transactions fit management’s core competency which is to add value through functional or physical repositioning and redevelopment.
A repositioning covers a range of property improvements. For example, a conversion of a large underutilized space into a series of smaller and more functional spaces. Or perhaps the addition of loading areas, truck access and the enhancement of fire-life-safety systems. Currently, Rexford has eleven properties being repositioned with a completion date that ranges from the fourth quarter of this year to the second quarter of 2025.
A redevelopment is when a building is fully or partially demolished and replaced with newly constructed building. Redevelopments also include the construction of a ground-up building on vacant land. Rexford has fifteen properties currently being redeveloped all with an expected completion date in 2024.
Business Model and Spread Investing
In economic theory, when a business can deploy assets and earn a return that exceeds the cost to acquire the assets then value is created. In the case of a REIT such as Rexford, value is created when the cap rate exceeds the cost of capital. This is especially important for a REIT because they are not able to retain earnings and have to rely on capital markets to fund their growth. In essence, Rexford is a spread investor. They tap debt and equity markets to fund acquisitions, redevelopments and repositions. They profit from the spread between rental income earned on the assets and the cost to finance the acquisition of the assets for which rental income is earned. For a REIT, this spread is the difference between the cap rate and the cost of capital. Let us now evaluate this spread in some detail.
Please take a look at Table 1 which presents Rexford’s acquisition activity for the year up until September 30, 2023.
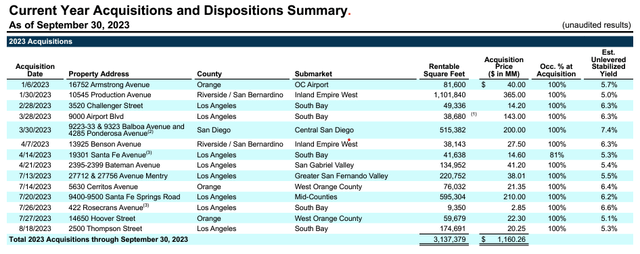
Table 1 (Rexford Industrial Realty Q3 2023 Earnings Supplement)
The estimated unlevered stabilized yield is akin to the cap rate. If you weigh each yield with the respective asset acquisition price in proportion to the total acquisition for the year to Sept. 30, 2023, you get a cap rate of 5.93% for acquisition activities.
Please take a look at the next table which presents the estimated unlevered stabilized yield for the repositioning activities for the year until Sept. 30, 2023.
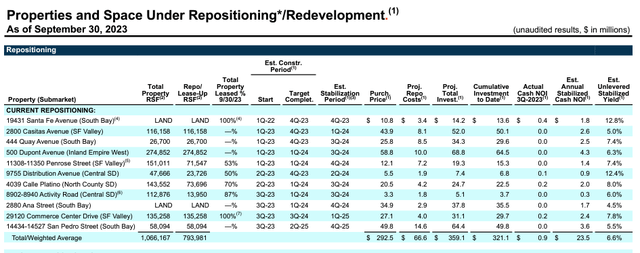
Table 2 (Rexford Industrial Realty Q3 2023 Earnings Supplement)
The cap rate for assets currently being repositioned by Rexford is estimated to be at 6.6%.
Next, we look at assets being redeveloped by Rexford. Please take a look at the next table.
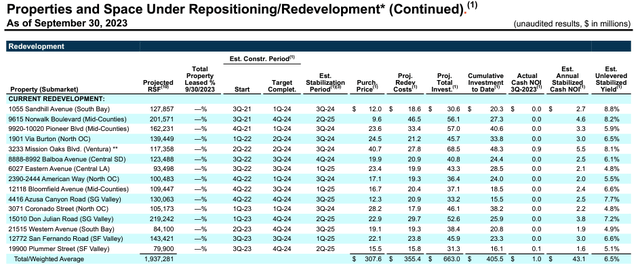
Table 3 (Rexford Industrial Realty Q3 2023 Earnings Supplement)
For their redevelopment activities, Rexford expects a cap rate of 6.5% upon completion.
Rexford only had one disposition for the year which was back in March which we will ignore in the analysis.
The total acquisition activity for the year up until September 30th was about $1.16 billion. The total investment for repositioning activities was $359 million and the total investment for redevelopment activities was $663 million. If you scale these figures by the stabilized yields for each activity, you get a blended cap rate of 6.50%. For Rexford to create value, the cost to finance acquisitions, redevelopment and repositioning should be less than 6.50% on a moving forward basis. Let us now calculate Rexford’s cost of capital.
Weighted Average Cost of Capital
In order to calculate the cost of capital, we have to calculate the cost of debt, the cost of equity, the cost of preferred equity, and scale each cost to the extent they are used in the business. Let us review the capital structure to see how much of each form of capital is being employed by Rexford.
Please take a look at Table 4 for Rexford’s current capital structure as of September 30th, 2023.
| Table 4: Capital Structure ($ in thousands) | ||
| Form of Capital | Value ($) | Weight (%) |
| Net Debt | 2,162,337 | 18.5 |
| Preferred Equity | ||
| Series B and C Cumulative Redeemable Preferred Stock | 161,250 | 1.4 |
| 4.43937% Series 1 Cumulative Redeemable Convertible Preferred Units | 27,031 | 0.2 |
| 4.00% Series 2 Cumulative Redeemable Convertible Preferred Units | 40,787 | 0.3 |
| 3.00% Series 3 Cumulative Redeemable Convertible Preferred Units | 12,000 | 0.1 |
| Common Stock and OP Units | 9,291,609 | 79.4 |
| Sum | 11,695,014 | 100.0 |
Source: Rexford Industrial Realty Q3 2023 Earnings Supplement for all the data in the table with the exception of the share price used to calculate the value of the common stock. I used the share price at the close of November 7th to arrive at the value of the common stock.
Now that we have a sense of their capital structure, let us calculate the cost of each form of capital and estimate the weighted average cost of capital. Let us start with the cost of equity.
There are different methods and philosophies around calculating the cost of equity. We use the Capital Asset Pricing Model (CAPM) in which we essentially add a spread to the risk-free rate and scale the spread by the volatility of a particular stock. Please take a look at Table 5.
| Table 5: Cost of Equity | |
| β | 0.89 |
| Risk-free rate | 4.57% |
| Equity risk premium | 2.66% |
| Cost of equity | 6.94% |
Source: The beta statistic is from Yahoo! Finance. The risk-free rate uses the 10-year Treasury on November 7th 2023.
The beta statistic measures the volatility with respect to the market. It is generally related to the nature of the business and the amount of leverage employed. The beta of 0.89 implies that Rexford’s stock is less sensitive than the market. Conceptually, this is justified since Rexford’s revenue stream is secured by contractual leases that have a dampening effect on the volatility of revenues. The weighted average lease term for Rexford is 3.4 years. Rexford has a debt ratio of 18.5% which also goes some way toward mitigating the volatility of the stock.
Moving on to the next statistic, the risk-free rate. I use the 10-year Treasury which is a frequently used proxy for the risk-free rate. Finally, the last input is the equity risk premium of 2.66% which is simply the spread between the implied cap rate of the industrial REIT sector and the 10-year Treasury from 2014 to 2019 that was referred to at the top of the article. The cost of equity arrived at using this approach is 6.94 %.
Let us now estimate the cost of debt. Rexford received a credit rating upgrade to BBB+ from S&P and Fitch and Baa2 from Moody’s in 2022. Please take a look at Table 6 for the median yield for the corporate Baa/BBB from Fidelity.
| Table 6: Issuer Rating and Cost of Debt | ||
| Description | Rating/Yield | Outlook/Time Horizon |
| Standard & Poor’s Rating Services | BBB+ | Stable |
| Moody’s Investor Service | Baa2 | Stable |
| Fitch | BBB+ | Stable |
| Corporate (Baa/BBB) Median Yield | 6.08% | 10-year |
Source: Moody’s, Fitch Ratings, S&P Global Ratings and Fidelity.com on November 11, 2023.
On a forward-looking basis, should Rexford access debt markets, it would be looking at a cost of debt of about 6.08%.
To estimate the cost of preferred equity, I take the preferred dividend and divide it by the liquidation value of the particular preferred equity and then take a weighted average. Readers may want to use the market values instead of liquidation values, however, some of the preferred equity is not readily traded.
The tax shield normally included in the calculation of the weighted cost of capital is ignored because REITs generally do not pay taxes at the corporate level.
Now that we have a cost of debt, the cost of equity, the cost of preferred equity and the weights of each in the capital structure, we can calculate the weighted average cost of capital. Please take a look at Table 7.
| Table 7: Weighted Average Cost of Capital (WACC) | |
| Weight of Debt | 18.49% |
| Weight of Preferred Equity | 2.06% |
| Weight of Equity | 79.45% |
| Cost of Debt | 6.08% |
| Cost of Preferred Equity | 5.16% |
| Cost of Equity | 6.94% |
| WACC | 6.74% |
Taking into account the current macroeconomic environment, Rexford would have to generate a cap rate of more than 6.74% to create economic profit. In the next table, we calculate the deficit.
| Table 8: Cap Rate Minus WACC | |
| Cap Rate | 6.50% |
| WACC | 6.74% |
| Difference | -0.24% |
Strictly speaking, since the cap rate doesn’t exceed the cost of capital, we could say that Rexford does not create value currently. It is financing acquisitions, repositions and redevelopments that will earn a 6.50% return with a cost of capital at 6.74%. This would probably be drawing the wrong conclusion from the data. For an evaluation like this in which small changes in one input can make a big difference in the output, you would like to see a widespread before drawing conclusions confidently. Also, there are limitations to this framework and items not considered. Context matters. Let us briefly look at those.
Considerations
The first thing worth considering is that since the end of the third quarter, Rexford announced on October 26th an investment activity of $245 million that is projected to generate an aggregate 6.8% initial unlevered stabilized cash yield. One interpretation of the investment activity is that management has acknowledged that the cap rates have to be higher and they are trending in that direction. This is a welcome development and restores a positive (although minimal) spread between the cap rate and the cost of capital.
The next thing to consider is that Rexford is a high-quality growth stock. NOI has grown from $123 million in Q3 2022 to $156.1 million in Q3 2023. This sort of growth is probably unsustainable. Management has offered an estimated NOI for 2025 that signals a 15.46% compound annual growth rate from here. Still lofty but achievable. When NOI grows, the cap rate increases, ceteris paribus.
Yet another item to consider is that Rexford has a distinct competitive advantage in the market they operate in. Scarce developable land and high barriers of entry typically show up in re-leasing spreads. For the third quarter, new and renewal rent change on a cash basis saw a 51.4% gain.
Finally, Rexford offers current investors a dividend yield of 3.35% and a five-year growth rate for dividends of 18.41%. The total return offered by the shares exceeds plausible measures of opportunity costs given the risk profile of the company. One measure of the opportunity costs is the cost of equity estimated earlier which came in at 6.94%.
Conclusion
Rexford is narrowing the gap between their cost of capital and their capitalization rate. If their recent transaction is any guide, they are on the way to restoring a meaningfully positive spread. Unlike many of their REIT peers, Rexford is not resigned to waiting for interest rates to come down or for rent escalators to outpace inflation. They have a strong business model that will continue to benefit from being situated close to population centers and trading ports. They also have a management team that has a track record of rewarding shareholders with dividend growth. Investors should consider adding these high-quality shares at the current price.
Read the full article here