Return Profile
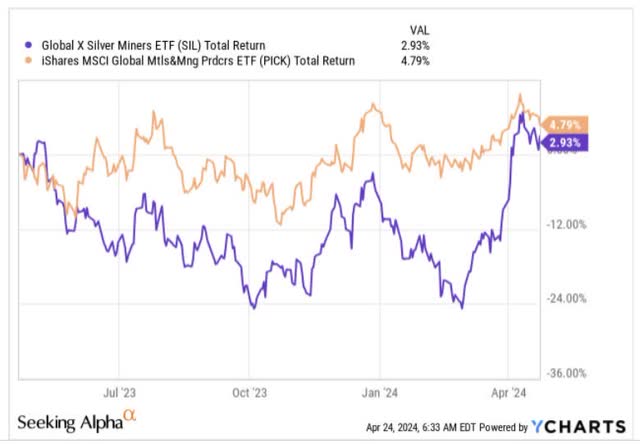
The Global X Silver Miners ETF (NYSEARCA:SIL), a ~$1bn sized ETF that offers coverage to 32 stocks involved in the mining of silver, hasn’t set the world alight over the past year. In fairness, even other metal and mining stocks haven’t done exceedingly well, delivering only mid-single-digit returns, but SIL has lagged slightly, delivering returns of less than 3%.
YCharts
Nonetheless, if you’re wondering if SIL can have a strong future, and you’re contemplating a position in this ETF, here are a few key things to note.
Product Profile
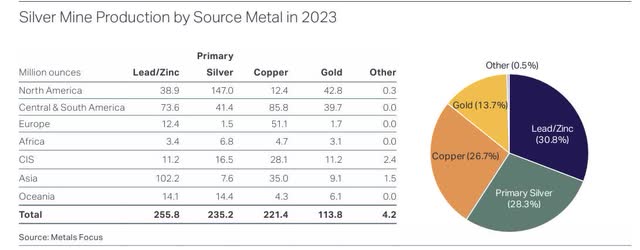
We appreciate SIL’s intent to craft a product of this ilk, and as mentioned in its prospectus, potential stocks need to generate “a significant part” of their revenue from silver mining, or closely related activities. However, it’s questionable if they really can stay true to that goal, as garnering exposure to just pure-play silver miners will be a difficult proposition; we say this because silver is largely just a by-product of mining other metals, notably lead, and zinc. In effect, just 28% of global silver output comes from primary silver mines.
Metals Focus
In keeping with this discussion, you’d be interested to also note that SIL’s top holding – Wheaton Precious Metal Corp (WPM), with quite a large weight of 22%, generates only a third of its revenue from silver; rather, around 65% of its topline comes from Gold.
So long story short, when you’re buying a product of this sort, do consider that the movements of quite a few stocks in this portfolio, won’t necessarily be dictated by what’s happening in the silver market, but in other markets and certain idiosyncratic events.
Silver Market Conditions
Silver Institute
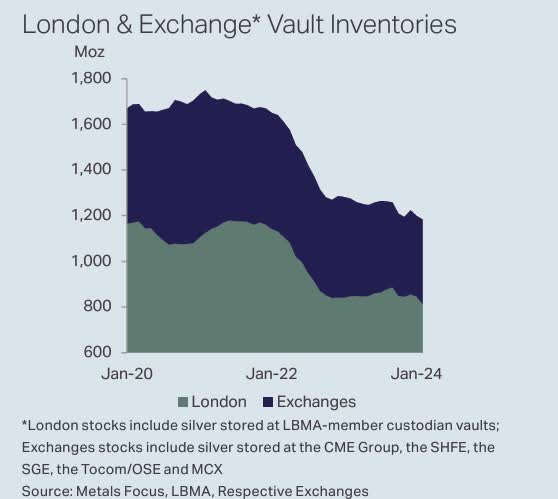
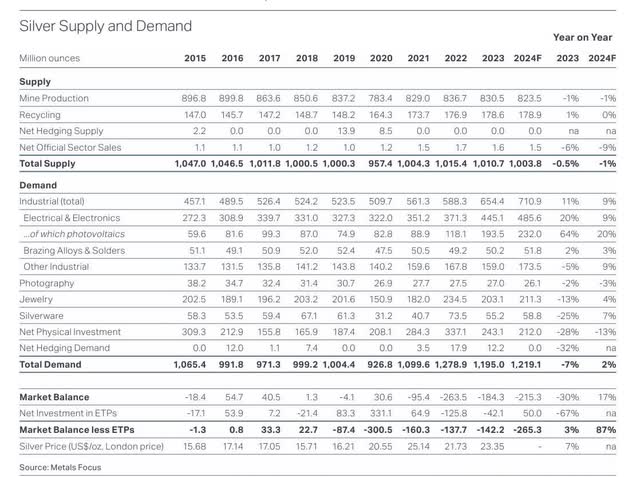
This year, the prospects of silver look fairly bright, particularly in the back half of the year, when above-ground silver inventories are likely to fade. That wasn’t quite the case at the end of last year when there were around 1200Moz of Silver in London and the other key exchange-certified vaults; this equated to at least 15 months of global supply, and was one of the reasons why silver prices didn’t quite see a significant uplift, even though the market was in a deficit position for the 3rd straight year (although this deficit did fall by 30%).
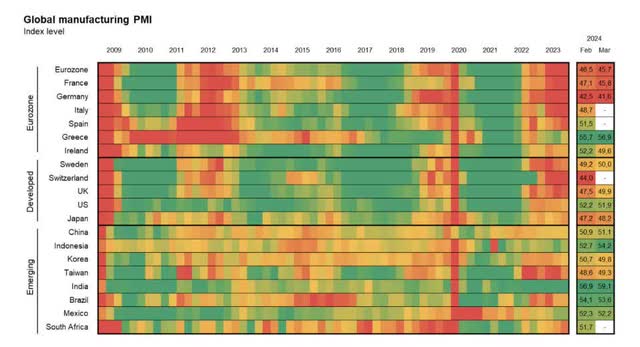
Now looking ahead, one may not necessarily see an immediate spike in demand, as silver’s prospects are closely linked to underlying industrial conditions. The image below can be construed to be an approximate forward-looking proxy of industrial conditions across the globe; here we can see that with the exception of a few EMs such as India, Brazil, Indonesia, and Greece, things aren’t too resplendent.
JP Morgan
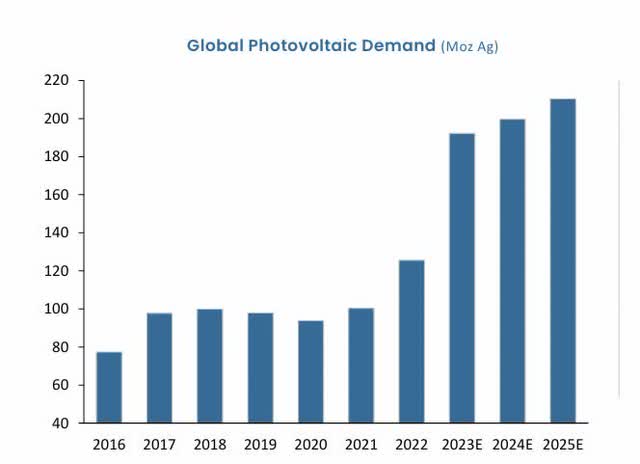
Much of the heavy lifting from the demand front could well be left to the photovoltaic segment. Over the years, there has been a deepening of R&D impetus to reduce the number of silver loadings in a solar cell, but given that silver has the lowest electrical resistance amongst all metals at standard temperatures, it is difficult to come up with an alternative that can equal the energy it generates per panel. All in all, the Silver Institute has suggested that despite a steep 64% spike in silver demand from the photovoltaics last year, even this year we could well see 20% growth (on a high base) from this segment.
Pan American Silver-April 2024 Presentation
On the other side of the equation, it must be noted that the supply side is currently grappling with some rather elevated AISCs (All In Sustaining Costs) which have grown by 18% and 25% two years on the trot. Besides that, silver production in Peru too is expected to come off in a big way, and SIL’s third largest holding- Buenaventura (7% weight) could be keenly impacted as it plans to suspend operations at Tajor Norte for 3 years. All in all, global mine supply is expected to come off by 823.5Moz in 2024, which would represent another -1% YoY decline. Given a favorable 2% uplift on the demand side, expect the overall deficit picture to worsen this year, giving a boost to silver prices.
Silver Institute
Closing Thoughts – Technical Considerations
Looking at the long-term backdrop, SIL appears to be one of those promising options that could potentially make up lost ground.
YCharts
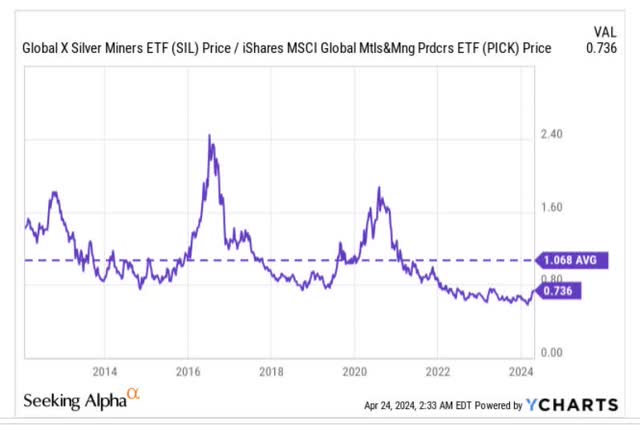
The chart above highlights how oversold the silver miners look relative to a diversified pool of other metal and mining producers. The current relative strength ratio of 0.736 is not far from record lows, and crucially, a good 30% off its long-term average, opening up some scope of mean-reversion.
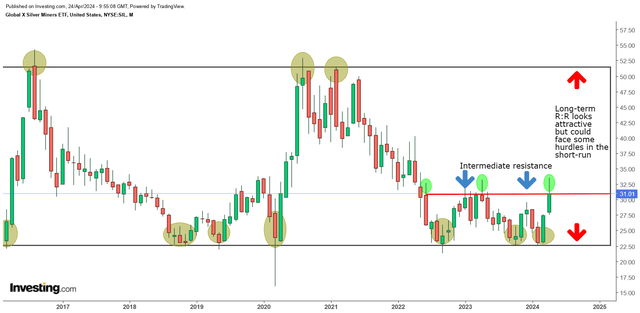
Then, SIL’s weekly chart, which covers the standalone price imprints over the last 8 years has shown us that this product typically chops around within an approximate range of $22-$52 or thereabouts (the areas highlighted in yellow show how the price has recoiled from these levels multiple times). Within this broad range, an entry at the CMP of around $31, certainly looks quite attractive from a reward-to-risk perspective (implied R:R of around 2.3x).
Investing
However, if we consider the intermediate developments within this broad structure, some cautions may be warranted in the near term. In June 2022, Jan 2023, April 2023 (the areas highlighted in green), we’ve seen quite a few instances where profit booking typically takes place (as exemplified by the long wicks of these candles, and further marked by the red line) and the April candle as well appears to be characterized by a long wick (although this could change in 1 week).
All in all, we feel the more suitable entry point would have been around the March candle opening/lows of $22-$23. At this juncture, we’d choose not to get too carried away and wait for a pullback.
Read the full article here





Leave a Reply