Investment Thesis
The ALPS Sector Dividend Dogs ETF (NYSEARCA:SDOG) is the ultimate contrarian play. Ranking near the bottom of the large-cap value category on critical factors like growth, momentum, quality, and sentiment, SDOG will likely only interest value investors drawn to its 4% dividend yield. However, today’s article highlights the sacrifices an investment in SDOG requires for only marginally higher income. To do so, I will discuss the fundamentals of two large-cap value ETFs yielding close to 4% and show that at least one should provide you with a safer and higher income stream over the long run. As a result, I don’t recommend SDOG, and I look forward to explaining why in more detail below.
SDOG Overview
Strategy Discussion
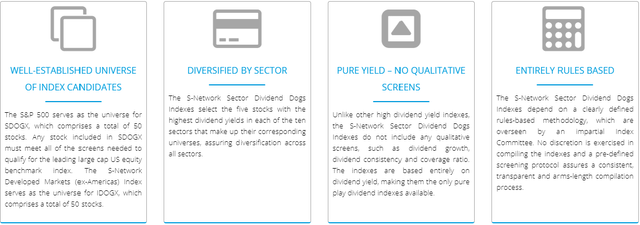
SDOG tracks the S-Network Sector Dividend Dogs Index and selects the top five dividend-paying S&P 500 stocks in each sector (excluding Real Estate). The Index equal-weights its 50 holdings, but notably, there are no additional financial health screens beyond those required to enter the S&P 500 Index.
S-Network Global Indexes
The Index provider highlights the absence of these qualitative screens in the third section above, and while it’s described as a positive feature to keep the Index a “pure play” on dividend yield, I view the feature negatively. Screens for dividend growth, consistency, and coverage are necessary to avoid yield traps. Furthermore, the increase in yield is only marginal. I expect alternatives like the Schwab U.S. Dividend Equity ETF (SCHD) to yield 3.91% moving forward compared to 4.00% for SDOG. Later, I will demonstrate what SDOG shareholders give up for this extra 0.09% in dividend yield.
Performance Summary
SDOG launched on June 29, 2012, and has a 0.36% expense ratio as of April 1, 2023. Since August 2012, it’s delivered a 217.74% total return compared to 374.74% and 284.93% for the SPDR S&P 500 ETF (SPY) and the SPDR S&P 500 Value ETF (SPYV), respectively. SDOG was also more volatile, leading to substantially lower risk-adjusted returns (Sharpe and Sortino Ratios).

Portfolio Visualizer
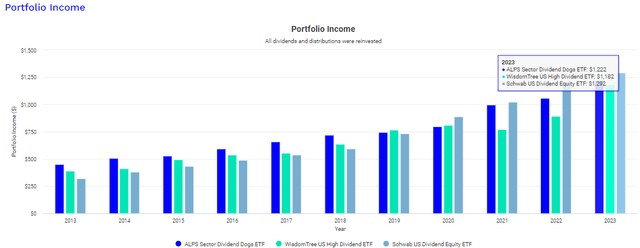
I included SPYV as a benchmark because SDOG is firmly in the large-cap value category. While SDOG’s trailing dividend yield is substantially higher (4.16% vs. 1.81%), 67% in total return is a lot to sacrifice. Besides, investors in 2013 who chose to reinvested dividends would come out ahead on income and capital gains with SCHD and the WisdomTree U.S. High Dividend ETF (DHS).
Portfolio Visualizer
Still, that’s not to say SDOG is destined to fail. On the contrary, it used to perform quite well relative to other large-cap value ETFs. Consider these annual returns and rankings from 2013-2023:
- 2013: 34.20% (#6/35)
- 2014: 15.00% (#6/39)
- 2015: -3.19% (#30/42)
- 2016: 22.48% (#4/48)
- 2017: 12.66% (#53/58)
- 2018: -11.40% (#56/64)
- 2019: 24.00% (#55/67)
- 2020: -0.35% (#52/69)
- 2021: 24.60% (#54/73)
- 2022: -0.21% (#13/80)
- 2023: 4.21% (#71/86)
If anything, SDOG is an inconsistent performer, capable of delivering first- or fourth-quartile returns but rarely in between. As such, a comprehensive analysis is necessary before declaring SDOG is due for a turnaround, so let’s do that next.
SDOG Analysis
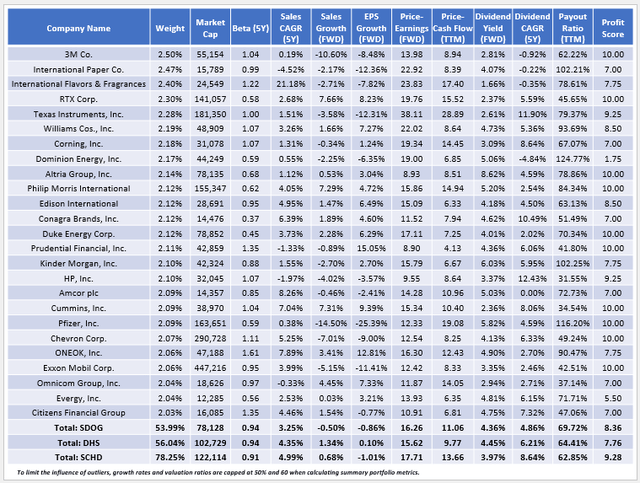
The following table highlights selected fundamental metrics for SDOG’s top 25 holdings, totaling 53.99% of the portfolio. I’ve also included summary metrics for DHS and SCHD in the bottom rows.
The Sunday Investor
Here are four observations to consider:
1. SDOG’s Index dividend yield is 4.36%, which is the weighted average yield for all 50 holdings. After subtracting the fund’s 0.36% expense ratio, I estimate shareholders will net 4.00% at current prices. In comparison, DHS and SCHD have 4.07% and 3.91% expected dividend yields, so there isn’t much difference. However, DHS and SCHD’s holdings have demonstrated more willingness to increase dividends, evidenced by their five-year annualized dividend growth rates (6.21% and 8.64% vs. 4.86%). In addition, SDOG, DHS, and SCHD have the following Dividend Scores, which I derived using Seeking Alpha Factor Grades and converted to a ten-point scale.
- Dividend Consistency: 7.51 / 7.73 / 8.46
- Dividend Growth: 6.28 / 6.54 / 8.13
- Dividend Yield: 7.62 / 6.85 / 6.91
- Dividend Safety: 6.62 / 6.85 / 7.29
These scores reveal how SCHD offers the best dividend consistency and dividend growth potential. It also has a marginally higher dividend safety score, which, in part, is related to its lower dividend payout ratio (62.85%). Notably, SDOG ranks last in all categories except yield.
2. SDOG trades at 16.26x forward earnings using the simple weighted average method or 12.82x using the harmonic weighted average method, which you’ll see on sites like Morningstar. Regardless of your preferred method, this valuation is the 13th-lowest among the 97 large-cap value ETFs I track. In addition, its 6.25/10 value score, derived from Seeking Alpha Factor Grades, is fourth-best and influential because it accounts for sector differences.
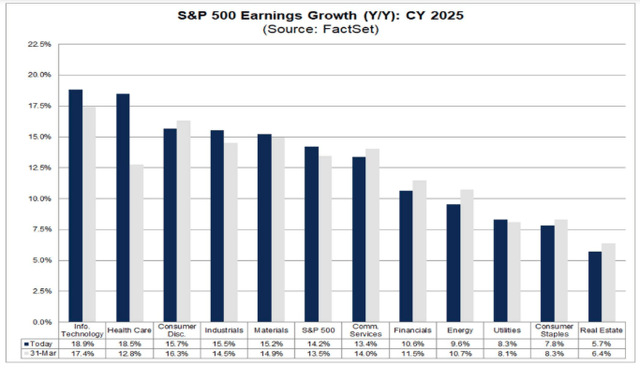
3. All three ETFs have flat estimated growth rates, an unfortunate reality for income investors. However, this wasn’t always the case. In my April 2022 review of SDOG, its earnings per share growth rate was 10.69%, but now, its -0.86%, with Wall Street analysts expecting earnings to decline for 27/50 holdings. Given how analysts at FactSet expect double-digit earnings growth in 2025 for most sectors, ETFs with flat earnings growth should struggle.
FactSet Research
4. SDOG has an 8.36/10 profit score compared to 7.76/10 and 9.28/10 for DHS and SCHD. For this reason, I don’t recommend DHS as an alternative. However, despite the recent poor performance of SCHD, I still believe it’s one of the best large-cap value ETFs available because it holds high-quality stocks. Growth is the problem, but as I mentioned, that’s the case with many dividend ETFs. Put differently, if you insist on owning a high-yield equity fund, you might as well get something else out of it. In SCHD’s case, that’s quality.
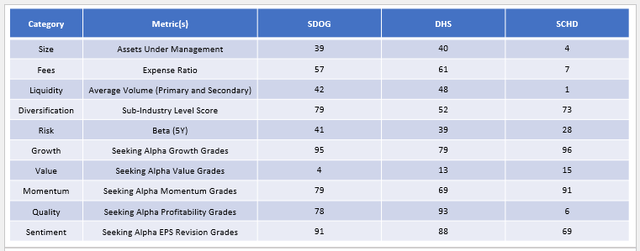
Finally, I want to highlight how SDOG ranks against other large-cap value ETFs on ten key factors. This table summarizes many of the points discussed already, but you can use it as a quick snapshot to help identify an ETF’s strengths and weaknesses. In this case, SDOG should only do well in value-oriented markets, as it ranks below average on all other factors.
The Sunday Investor
Investment Recommendation
SDOG is a sector-neutral fund with a 4.00% expected dividend yield. Following the “Dividend Dogs” strategy that selects the five highest-yielding stocks in each of the 10 GICS sectors (excluding Real Estate), SDOG is also deeply-discounted but presents little opportunity for success in markets where value stocks aren’t in favor. While SDOG is not destined to fail, I am discouraged by its constituents’ flat estimated sales and earnings growth rates, and I believe it will struggle in the near term. SCHD, while not perfect, offers much more exposure to the quality factor and a competitive 3.91% expected dividend yield, and is my preference between the two. Thank you for reading, and I look forward to your comments below.
Read the full article here


Leave a Reply