Investment Summary
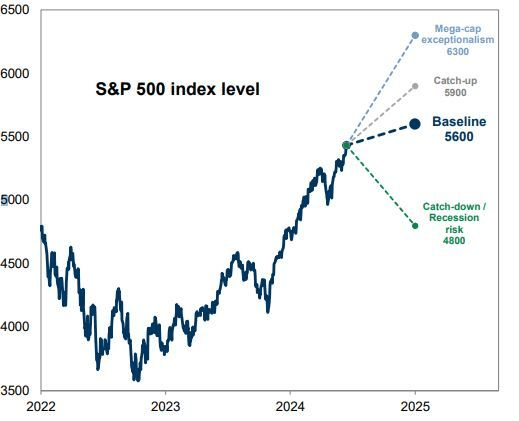
As we enter the halfway point of 2024, positioning for the remainder of the year is now paramount. Goldman Sachs (GS) has increased its S&P 500 index target by 300 basis points for year-end, calling for a 5600 level (400-point increase). David Kostin, the bank’s chief equity strategist, noted a better earnings outlook and a higher P/E multiple of 20.4x (19.5x previous).
Figure 1. Goldman Sachs revised S&P 500 Index scenarios [June 2024]
Goldman Sachs
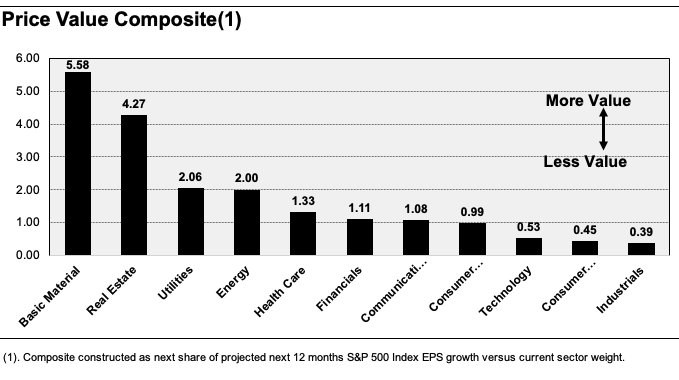
This optimism provides a solid bedrock for the basic materials sector. It presents attractive fundamentals when comparing (1) its current sector weighting in the S&P 500 Index to (2) its projected earnings growth rates over the next 12 months (Figure 2).
This has led us to analyze the investment and business prospects of RPM International (NYSE:RPM).
Figure 2.
Author, with data from Seeking Alpha and Bloomberg
RPM shares have caught a strong bid over the past 12 months, however that momentum has begun to slow. The company has worked its way into lofty valuations, now trading at 23.7x trailing non-GAAP earnings and more than 6 times the assets employed in its operations.
There may be some justification for this, or not. I am curious as to why the market has priced this company at such a high value compared to the earnings and assets of the business.
In my estimation, the provable facts pattern demonstrates:
- That RPM has attractive economic characteristics that could see a trade higher over the coming 3-year period
- However, I also believe these prospects are well reflected in the company’s current valuation multiples.
I estimate that investors are paying for the growth in its CPG and PCG segments [discussed later], and this is evidenced by 1) the change in EV/invested capital multiple since 2021, 2) little corresponding change in post-tax earnings multiples, and 3) the highest pre-tax growth is in these segments.
The upside scenario, in my view, means the company 1) continues running >11% pre-tax margins and 2) produces 2.5%–3% sales growth over the coming 3 years. If it falls behind on these key thresholds, my opinion is the current market value is about fair. Net-net, rate hold.
Background fundamentals
RPM was originally known as Republic Powdered Metals, Inc.. It has a storied history dating back to its incorporation in 1947. The company – which underwent a reincorporation transaction in 2002 to succeed RPM, Inc – has grown into a global leader in specialty chemical products, with brands such as Carboline and Rust-Oleum, among many, many others on its books.
Over the decades, RPM has expanded its portfolio to include a wide array of specialty chemicals (think specialty paints, protective coatings, sealants, adhesives, and so forth). It sells these products to the industrial and consumer markets. RPM (via its subsidiaries) has a footprint of products in ~164 countries and operates 121 manufacturing facilities worldwide. To give perspective of its size, in the 12 months to Q1 FY 2024, it generated $7.3 billion in net sales.
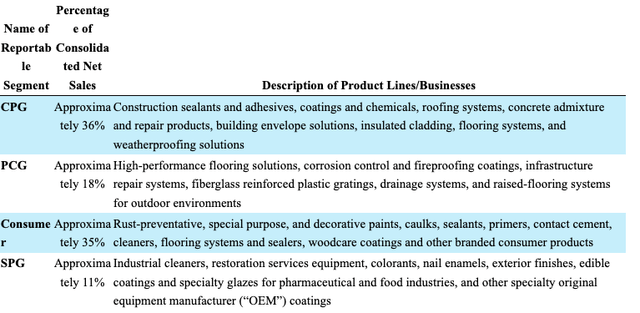
RPM operates through four distinct business segments: (i) Construction Products Group (“CPG”), (ii) Performance Coatings Group (“PCG”), (iii) Consumer Group, and (iv) Specialty Products Group (“SPG”):
Figure 3.
Company filings
Industry outlook
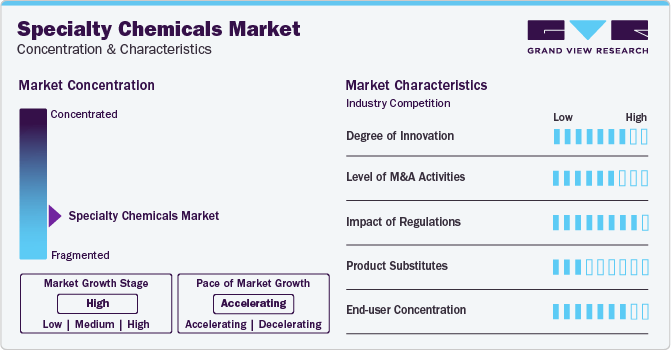
The specialty chemicals industry is projected to grow to a value of $940 billion by 2031 increasing at a compounding growth rate of 4.9% per year. Additional research projects the industry to grow at 5.2% over the same period. These are reasonable growth estimates in a rather refined portion of the materials sector. Key tailwinds for the industry include 1) the growing demand for specialty materials, 2) construction trends, and 3) higher net import activity of these products from The European Union. Grandview research suggests the industry is currently in a high growth stage, with growth currently accelerating as we speak (Figure 4).
Figure 4.
Grandview Research
Key insights from Q3 FY 2024 earnings
RPM put up $1.5 billion of sales in Q3 FY 2024, ~40 basis points increase on Q1 last year. Adjusted EBIT margin expanded! ~170 basis points thanks to 1) benefits from the MAP 2025 initiative and 2) improved fixed cost leverage in the CPG and PCG businesses.
To illustrate:
- CPG Q1 sales were up 4.3% on 51% reported EBIT growth [11.8x operating leverage];
- PCG revenues were up ~690 basis points on a 45% increase in adj. EBIT [6.5x] operating leverage.
Weighted on a 67%/33% basis to CPG/PCG respectively, (reflecting the contribution to revenues) the average operating leverage management created on the cost base was 10x.
It pulled this to earnings growth of 40.5% to print $0.52 per share at the bottom line, marking a third-quarter record.
Looking ahead to Q4 FY 2024, management expects consolidated sales to remain flat year over year. Consensus eyes ~100 basis points growth on last year, stretching up to 3% in FY 2025.
Analyzing RPM’s projections and recent performance, several critical points emerge for investors in my opinion:
-
The flat overall sales projection for Q4 and FY 2024 is being propped by the CPG and PCG segments. This has implications for the company’s valuations (discussed later).
-
Cost management and margins – one can’t ignore the leverage on fixed cost management produced in the last quarter. On the flat revenue growth, consensus eyes 14% pre-tax earnings growth, otherwise ~14x operating leverage for the year.
- This could have implications to earnings revisions in my view. There’s been 5 revisions to earnings growth to the upside in the last 3 months, balanced against 6 downside. The operating leverage discussed above provides solid ground for an earnings surprise in my view.
In that vein, investors should pay close attention to the company’s pre-tax earnings growth relative to sales growth for the upcoming quarter in my view.
Fundamental economics of business operations
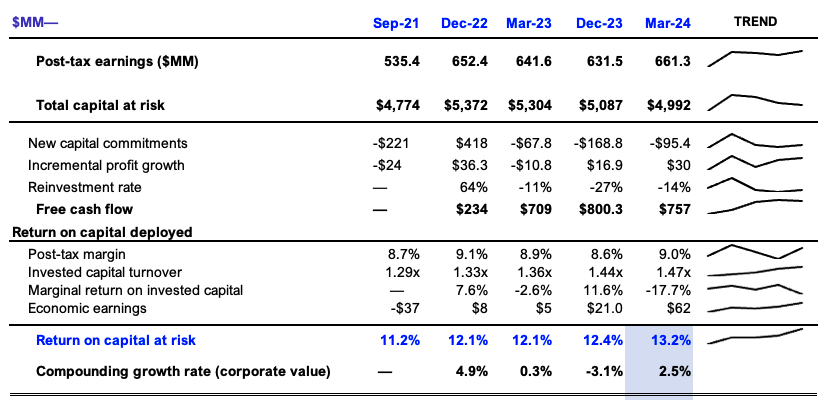
The fact is this is a large operation with expensive business lines. I have consolidated the company’s business economics into a single set of statements, as seen in Figure 5. The key factors to note are the following:
-
Post-tax earnings have increased from $535 million-$661 million on a rolling 12-month basis since 2021.
-
There has been a linear growth in invested turnover from 1.3x in 2021 to 1.47x in the last 12 months. This has led to a similar increase in the returns produced and invested capital from 11.2% to 13.2% – a 200 basis point incremental gain.
-
It has thrown off $700–$800 million in free cash flow on each rolling 12-month basis from Q1 2023–’24.
Figure 5.
Company filings
These are attractive economics in my view. It is rotating ~$1.50 in sales per $1 of capital invested in the business, producing $0.13 in trailing earnings on the same $1 of capital.
The incremental numbers speak volumes too:
-
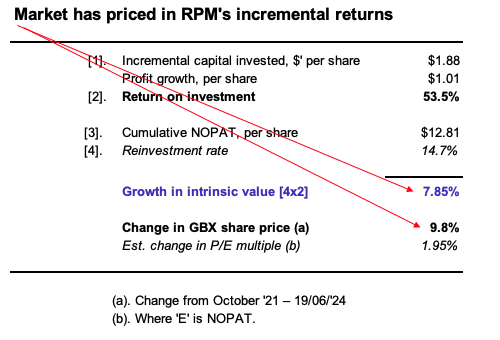
An additional $1.88/share has gone back into the business as reinvestment, producing $1.01/share in additional earnings after tax.
-
The incremental return is 53% on this and it reinvested 14.7% of the cumulative NOPAT earned over this time. The growth in intrinsic value from this is ~8%.
The problem is the market looks to have recognized this performance as well, increasing the stock price by 9.8% over this time. In that vein, my view is that it has 1) reflected the fundamentals in the current market value, and 2) also increased the P/E multiple by around 1.95% on this (well within normal range).
As such, the company is rotating $1 incremental capital invested into an additional dollar of market value.
Figure 6.
Company filings, author
Estimates of corporate value
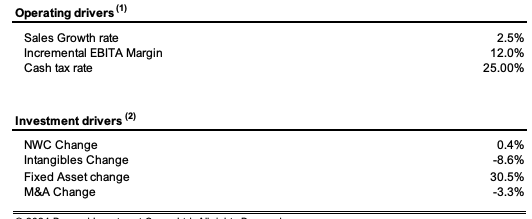
Management’s capital allocation decisions alongside the financial performance of the company on a rolling 12-month basis since 2021 I observed below. Sales have grown around 2.5% each period, with an increasing pre-tax margin of 12%. Notably, this is higher than the 5-year average pre-tax margin of 7.4%, corroborating the margin uplift discussed earlier.
To produce a new dollar of sales, management has had to invest $0.30 into fixed assets, with a small investment of $0.04 into working capital. It has wound down intangibles exposure whilst soliciting this growth.
Figure 7.
Company filings, author
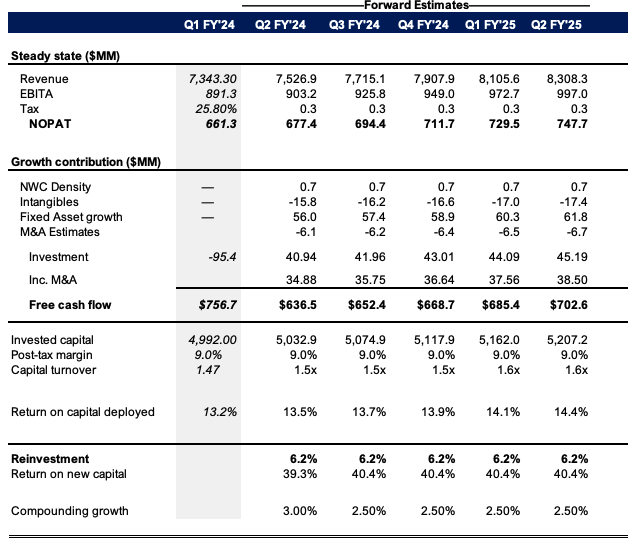
My estimate is that these are fair projections to carry forward based on 1) the industry outlook [discussed earlier], 2) consensus revenue projections of circa 2.5% to 4% to FY 2026, and 3) The right at which management is deploying incremental capital into the business.
Carrying these projections forward as a “steady state“ set of operations, my estimates project $8 billion in top line sales by 2025. This is around $400 million ahead of consensus estimates for the same year. It is not unreasonable to expect the company to compound its intrinsic valuation at 2.5% per period under these assumptions.
Figure 8.
Author estimates
Valuation
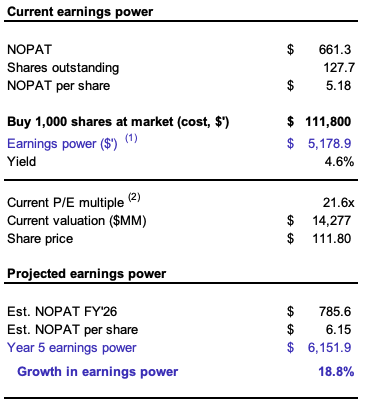
The case for valuation hinges largely on the projected growth rates used versus margin changes. There are several ways to illustrate this. If we buy 1,000 shares of RPM at market today, we pay and receive the following:
-
Cost $111,800,
-
Post-tax earnings of $5.18 per share, giving earnings power of $5178.
-
Return on market capital 4.6% (analogous to earnings yield).
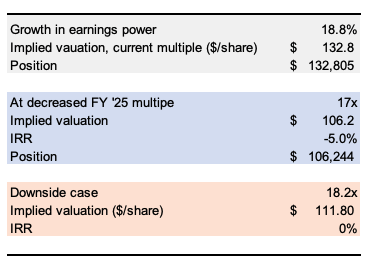
Should management hit the growth estimates outlined in the steady state above, earnings power would grow 19% to $6,151. This presumes a 21.6x multiple getting us to a valuation of $132 per share.
But if the multiple sharply contracts down to 17x for example (32% contraction) opposition would be valued $106,244, for a loss of 5% on our money. In that vein, my opinion is the tolerance is a contraction to an 18.2x P/NOPAT multiple for RPM to still trade fairly.
Figure 9.
Author estimates
Author estimates
Investors have increased the multiple paid on invested in the company from 2.8x in 2021 to 3.4x at the time of writing. They have not however increased the multiple paid to post-tax earnings, currently at 25.8x.
Figure 10.

Author estimates, company filings
Scenario 1.
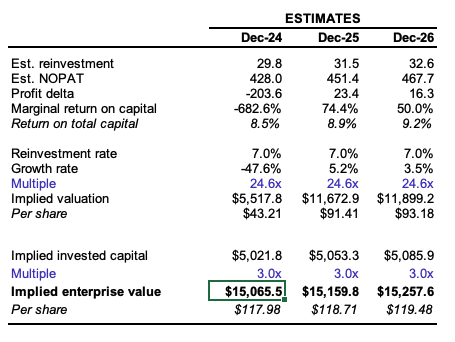
If the company does not manage a 2.5% growth rate going forward and hits 1.5% to 2% instead, this changes the estimate substantially, as seen below.
Further, should investors pay the 3x multiple to implied capital invested, this implies the stock is fairly priced where it trades today. Paying a <25x multiple on after-tax earnings would suggest the stock is overvalued.
Figure 11.
Author estimates
Scenario 2.
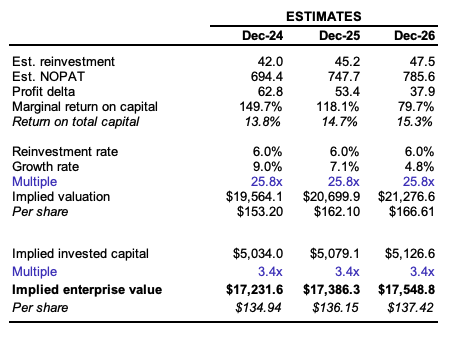
If management does hit the projected growth targets outlined, and investors maintain the 3.4x multiple on capital invested, then we get to a valuation range of $134-$137 per share. Investors could still pay less than 25x tax earnings and derive a valuation in the $130s.
Figure 12.
Author estimates
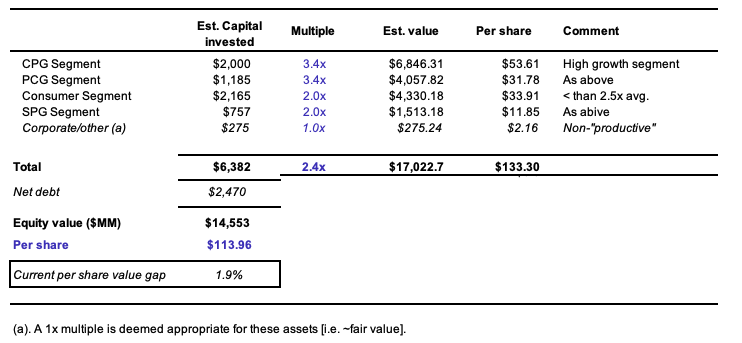
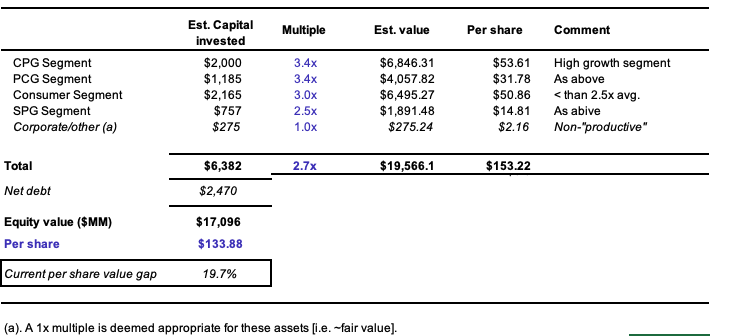
A similar view is taken on the sum of the parts valuation on each of the company’s operating segments. Here I assign a high-growth multiple to its CPG and PCG segments, winding this down on its slower-growing divisions. Again, the growth rates matter – a higher multiple on its SPG and consumer divisions raises the from $114 per share to $133 per share.
In that regard, my opinion is the company needs to continue growing its PCG and CPG segments for investors to maintain a high multiple paid on the corporation’s assets. Should this recede, the momentum may kindle down to ash.
Figure 13.
Author estimates
Figure 14.
Author estimates
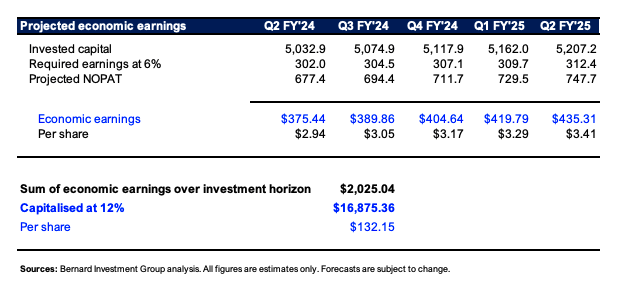
Further support is found when projecting these free cash flow out over the coming five years and indexing them against a capital charge of 6%, which represents the starting yields on most investment-grade corporates as I write. Then discount these at 12% hurdle rate, then some the per share values. Again, I get to a range of $132 per share if the company hits the 2.5% sales growth rate on average out to FY 2026.
Figure 15.
Author estimates
Downside and upside risks
The key downside risks include 1) the company not hitting projected growth targets, 2) contraction of pre-tax margin below 10%, 3) investors contracting the EV/IC multiple to below 2.5x. These events are not directly known, but in my view, these are the downside factors.
On the upside, the company could grow more than the 3.5% rate, and investors could increase the multiple paid on post tax earnings. If this occurs, a valuation of $132-$135 could seem highly likely in my view.
Investors should familiarize themselves with these risks before proceeding any further.
In short
RPM management has demonstrated excellent use of capital allocation to grow the rate of earnings relative to assets in the business. Incremental profits have grown with each passing investment made into its operations, and the company is throwing off stable, high free cash flows every 12 months.
The issue I see is that investors have reflected these fundamentals well in the current market value. This is not a bad thing, rather it is a good sign – but one that reduces the potential asymmetries for the new investor. The upside case in my view rests on management producing a 2.5% average sales growth rate out to 2026 on >10% pre-tax margins. If it doesn’t achieve this, today’s value seems about right. Without 1) the conviction, and 2) the high expectations embedded into its stock price, I rate RPM a hold.
Read the full article here









Leave a Reply