Welcome to another installment of our BDC Market Weekly Review, where we discuss market activity in the Business Development Company (“BDC”) sector from both the bottom-up – highlighting individual news and events – as well as the top-down – providing an overview of the broader market.
We also try to add some historical context as well as relevant themes that look to be driving the market or that investors ought to be mindful of. This update covers the period through the third week of June.
Market Action
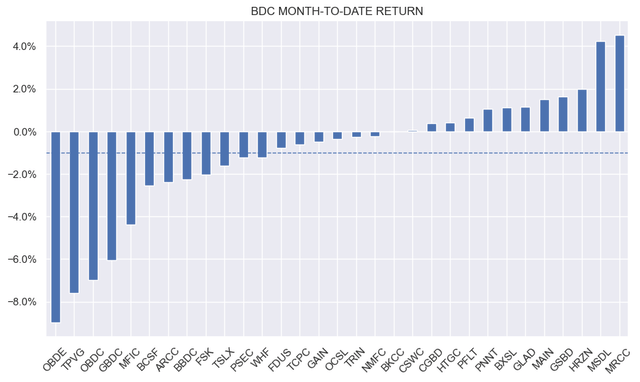
BDCs were flat on the week and slightly lower month-to-date. The worst performers in June have been OBDE which had a lock-up expiry, creating an attractive entry point, and TPVG whose CFO exit pushed the stock lower.
Systematic Income
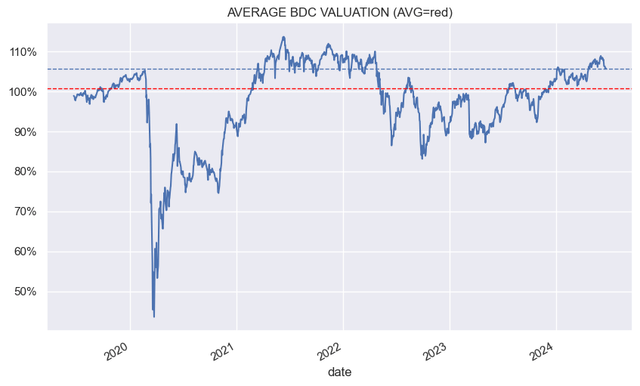
Sector valuations have come off slightly but remain not far off the top of the range in the last 5-10 years.
Systematic Income
Market Themes
As the BDC sector valuation chart above highlights, BDC valuations have climbed steadily after the drawdown in 2022 and have more-or-less returned to their 2021 level. What does this tell us about the sector?
For one, and as we have discussed earlier, we shouldn’t necessarily expect BDC valuations or prices to move lower if the Fed starts to cut the policy rate. Such cuts would result in lower net income levels. Short-term rates were near zero in 2021 and valuations were even higher than they are today.
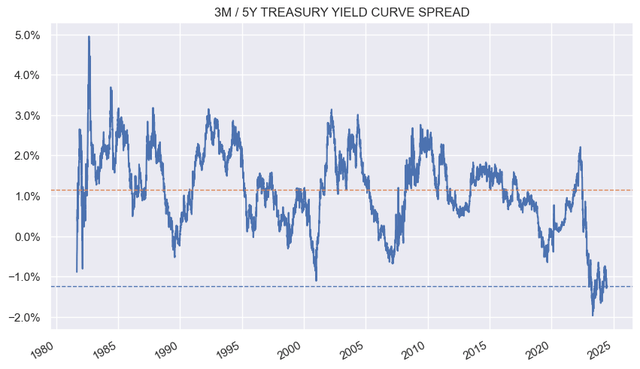
This happens for the simple reason that BDCs don’t exist in isolation. If interest rates move lower, lots of other income securities will see lower yields as well. The thinking that investors will leave BDCs en masse and migrate to fixed-coupon securities doesn’t really make sense given the starting point of today’s yield curve which is significantly flatter (i.e. more inverted) than the historic average.
Systematic Income
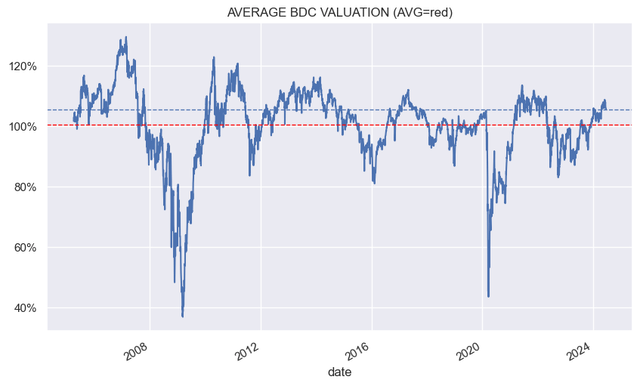
Two, the risk to valuations is asymmetrically lower. Today’s average valuation of around 107% is well above the longer-term average. Historically, with rare exceptions valuations have tended to either stall above 110% or shoot past but revert back relatively quickly. Similarly, with rare exceptions (e.g. recessions), valuations have tended to bottom around 80%. This highlights that the next big move in valuations is likely to be lower than higher. This is not a timing signal but it is a historic pattern.
Systematic Income
Three, as we saw in 2021, in our view the greatest risk to the sector is not rate cuts and potential distribution cuts but a drop in risk sentiment and / or significant macro deterioration. The view of a hard landing scenario is the lowest it has been in the Bank of America survey. And although BDC portfolios have generally been performing well, the added risks versus 2021 are a much lower level of interest coverage, lower recoveries and increased lender-on-lender violence. These factors could test the sector in a downside market scenario.
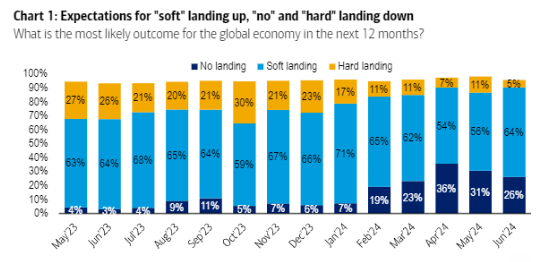
BOA
BDC Tool Update
This week we added the BDC Bain Capital Specialty Finance (BCSF) to the BDC Tool.

Systematic Income BDC Tool
At first glance there was something odd about its behavior. We all know that pretty much every BDC NAV fell in Q1 of 2020 as markets blew up. However, there was a sharp NAV bounce in Q2 as spreads and sentiment recovered and prices rallied. We don’t see that bounce in BCSF. And investors who follow GBDC may also remember that GBDC had a bad Q2 as its NAV fell. What happened there was that both BCSF and GBDC held a rights offering to raise equity in order to deleverage. Once we take this into account, we see that BCSF is a decent performer with a roughly average return profile.
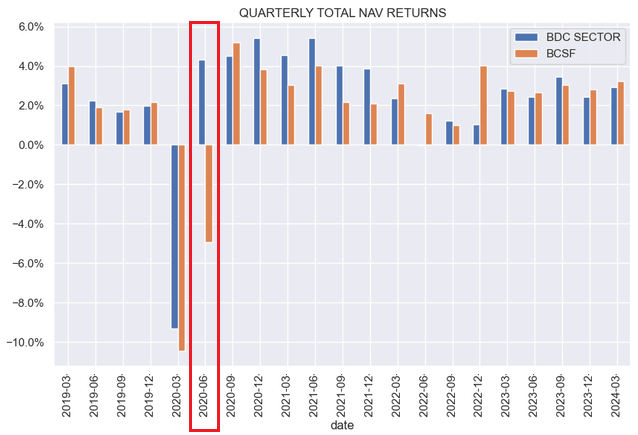
Systematic Income
Overall, it’s fairly appealing here – valuation is around 15% below average with the 3Y total NAV performance at around the average level. If we stretch the performance period further, it becomes only modestly appealing. The time to have bought it was in the first half of 2023 when it was trading at a valuation 20-25% below the average.
Stance And Takeaways
Earlier this week we rotated back into GBDC after its valuation normalized to a more attractive level, trading at the median valuation level and below the average in our coverage. The company features the lowest management fee structure in our coverage which, along with a resilient portfolio, has allowed it to generate an above-average total NAV return over the past year.
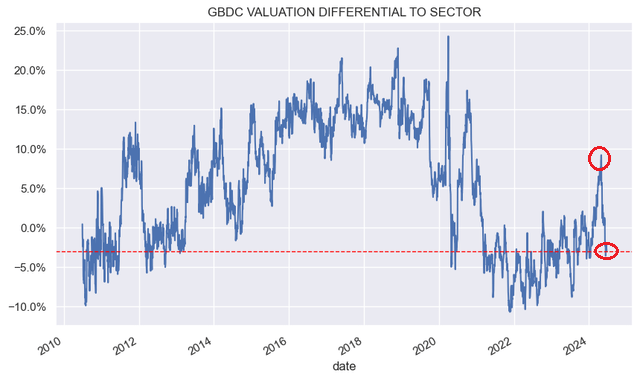
Systematic Income
Check out Systematic Income and explore our Income Portfolios, engineered with both yield and risk management considerations.
Use our powerful Interactive Investor Tools to navigate the BDC, CEF, OEF, preferred and baby bond markets.
Read our Investor Guides: to CEFs, Preferreds and PIMCO CEFs.
Check us out on a no-risk basis – sign up for a 2-week free trial!

Read the full article here


Leave a Reply