The natural gas (NG1:COM) rollercoaster continues with what, we believe, will be a richly laden bull market. Early signs plus projections appeared this summer. Our last article reviewed the analysis of our prediction some months ago that the price would follow stair steps in its recover. This stair step was predicted in Natural Gas’ Hidden Future Of Muted Rising Prices. In even another article, our warning or observation concluded that the changes most likely would come subtle. We argued that an additional 5 BCFPD of spare capacity at breakeven prices slightly above $2 forces naturally buffered steps up through 2024 and beyond. Increased demand from both cooler winters and LNG production will drive the next increase. The time is getting closer; it’s now time to set the alarm. Now, put down that phone and pay attention. It will be subtle.
A Changing Balance
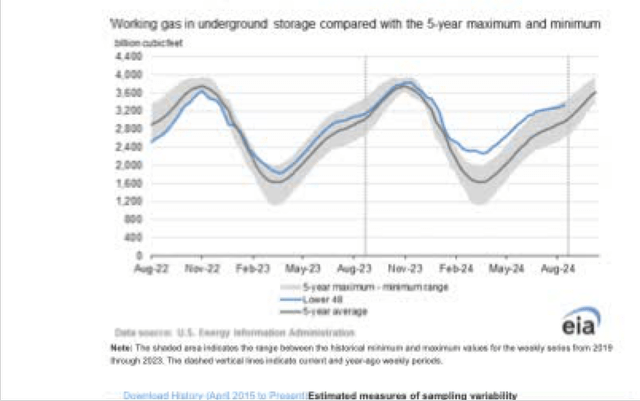
First, let’s head to the balance. The EIA publishes energy data, including natural gas. A weekly storage report graphic shows the change with which we refer.
EIA
Investors should pay attention to the slight drop on the right in the cyan line toward the 5-year average line, a dark-colored line centered in the shaded area. Next, a table generated from our own data collection taken again from the EIA discloses more detail.
|
NG Production-Storage Info. |
Production This Year BCFPD * |
Production Last Year BCFPD |
Difference (5-year to-date) BCF |
| 3/15/2024 | 105.3 | 105.5 | 678 |
| 7/12/2024 | 108.4 | 107.6 | 465 |
| 8/16/2024 | 107.8 | 107.8 | 299 |
*Of note: producers produced approximately 111 BCFPD during the beginning of the year.
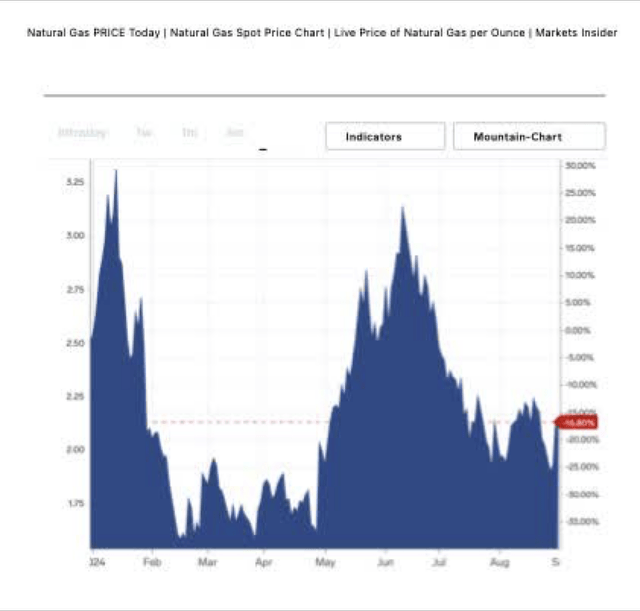
We leave this discussion and head for a NG price chart from Business Insider.
Business Insiders
Over the past nine months, the price has ranged from the high $1s and $3 with an average near $2.5 inline, nicely within our estimate.
The North American Winter
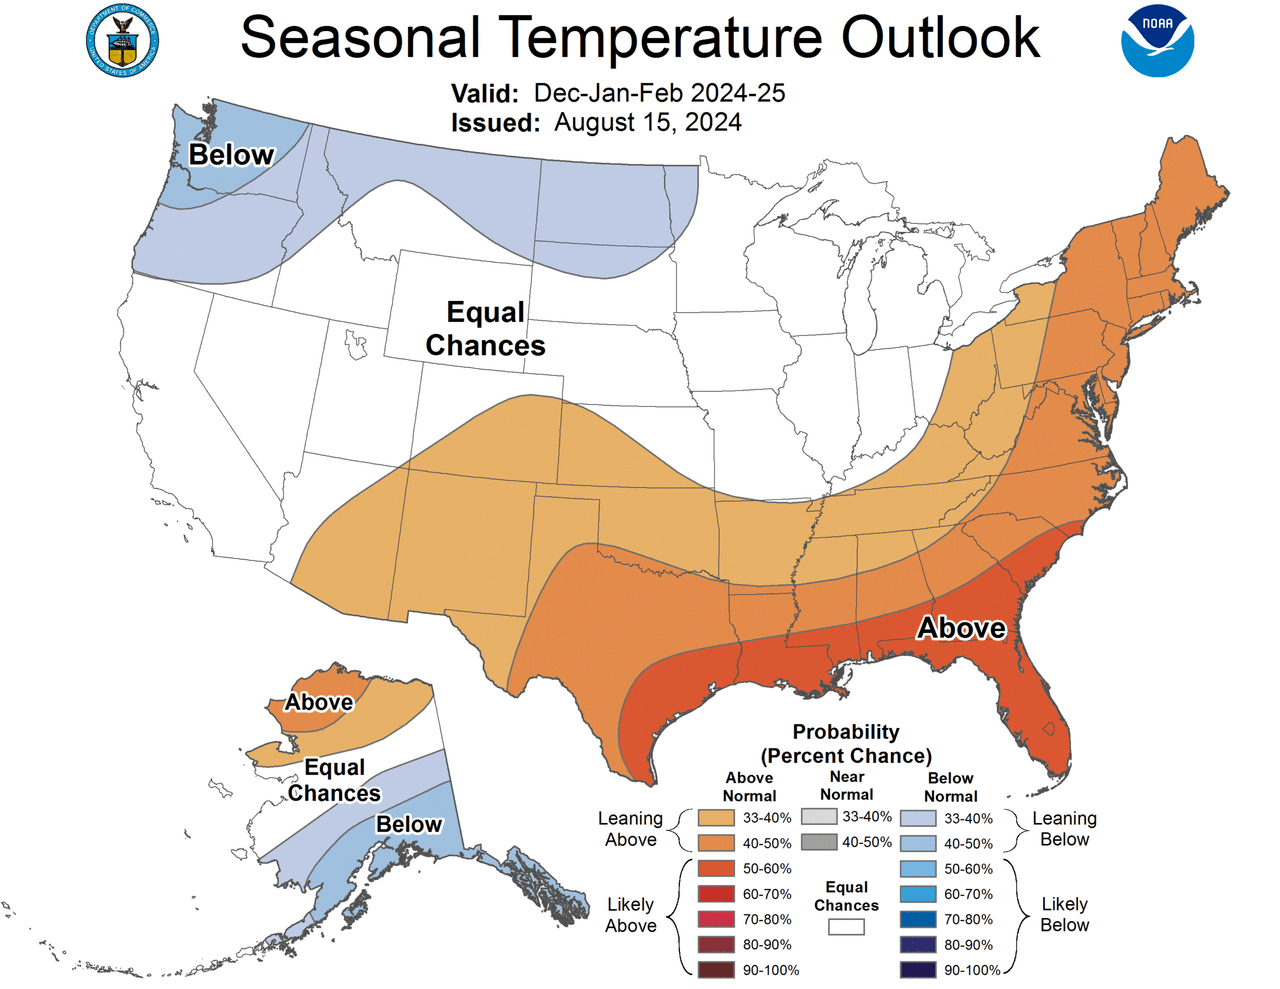
Now, our thoughts turn to change, a real change. With winter approaching, the always accurate, wink, wink, weatherman like to predict what’s coming. One headline appeared in August stating that the El Niño pattern with its warmth dissipated leading into La Niña, cooler temperatures.
- La Niña is characterized by cooler than normal tropical Pacific Ocean surface temperatures.
Its forecast summarized in the next graphic shows higher probabilities for cooler weather patterns lasting up to three winters. The graphic is for this winter.
Weather Channel
In the past few winters, the El Niño pattern created especially warm winters in particular, last winter. This warmth significantly reduced the winter use of natural gas, resulting in the above higher storage deviation. Again, that is changing.
Coming Growth & Expected Price
With weather and energy requirements going forward aligning, investors might expect that a bottom or floor is in place or close. Again, demand from seasonal colder North American winters plus economic growth particularly overseas could add strains on existing capacity, shunted by low investment during the last few years.
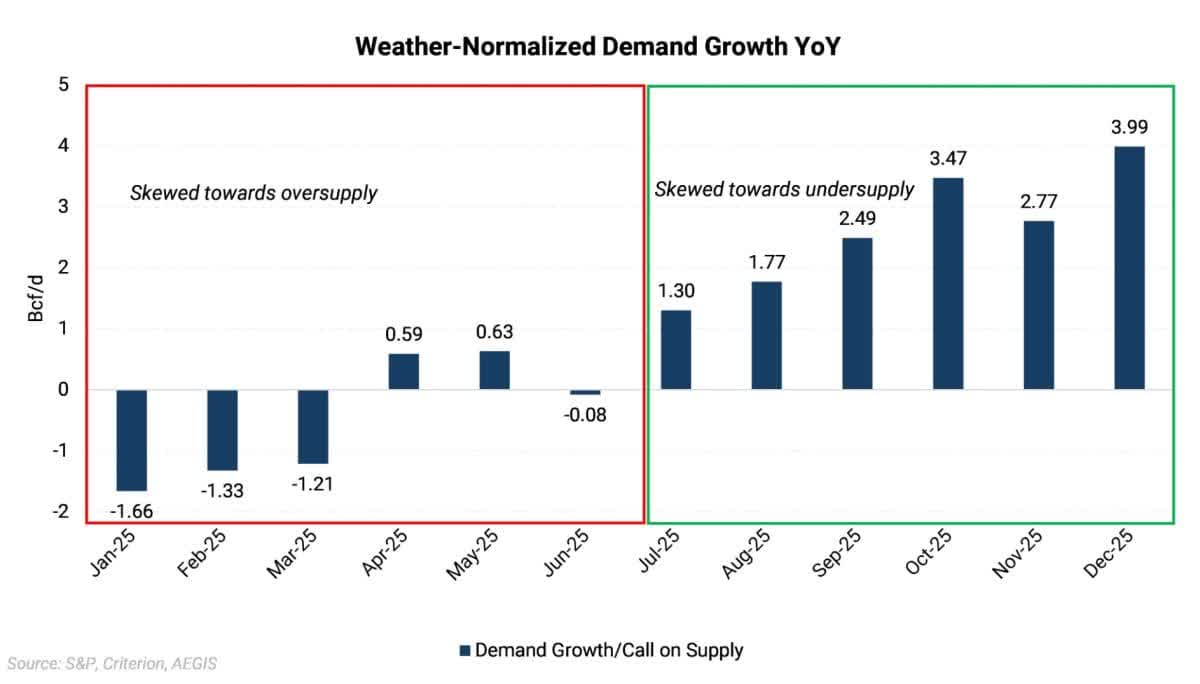
An article posted at Oilprice, a must-read by all those interested in natural gas, outlines a possible price explosion 1-3 years in the future. It opens, “Significant changes to Lower 48 natural gas supply and demand are expected in 2025, potentially leading to large price impacts on Henry Hub.” Followed by explanations for why the stellar increase in demand is likely delayed by one half of a year. The author, AEGIS, included an extremely helpful chart. The displayed data normalizes weather though using 10-year averages. Based on start-ups of LNG facilities from world demand growth, the graphic shows the significance of the coming increases.
Oilprice
The lower year-over-year demand numbers in the first half are mainly due to a forecasted decline in power sector natural gas demand, which many people may be surprised by or disagree with. The decline in gas power demand is driven by the continued build out of renewable assets such as wind, solar, and batteries. Anyone believing this should take a second look at the past not so successful history. Now from the article:
For this, we took the EIA’s numbers for renewables currently under construction, applied a capacity factor, and converted to Bcf/d. LNG feedgas demand growth eventually offsets the decline in gas power demand, resulting in strong demand growth numbers in 2H 2025.”
Continuing:
The point where the weather-normalized supply-demand balance flips has been pushed back over the past few months by delays to incoming LNG projects, most recently being the delay of Golden Pass LNG to the end of 2025.”
By the middle of 2025, a significant and impactful shortage of between 1 BCFPD to 4 BCFPD is predicted.
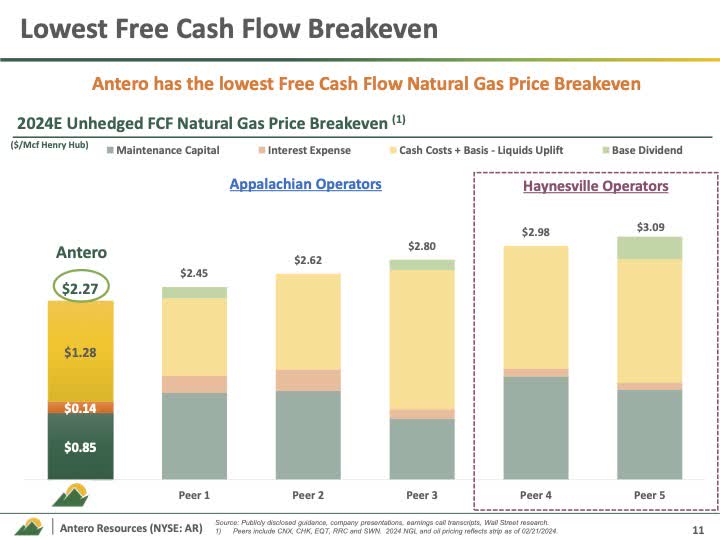
The next question becomes at what price? In an Antero Resources (AR) report, management added a slide. On the far right, the Haynesville Operations requires $3 per therm for breakeven. This suggests at least $4 per therm is needed to once again induce significant investment. We expect at least $4 in reality, much higher.
Resources
Investing
Finally, if NG prices will once again head north meaningfully, NG companies, unhedged companies, present themselves as being by far the best approach. Antero Resources falls in that category with its extremely low-cost position. The key is unhedged. Other investors might know of other opportunities.
Risk
Recessions always provide risk, especially in the industrial demand. But, in our view, a secondary more extreme risk exists, a change in Washington policy. One of the candidates is laser focused on lowering energy costs. That focus might not succeed, but continual price pressures will happen. Personally, on natural gas, we don’t see anything under $4 sustainable. Severe recessions, warm winters, might soften demand. Yet, watching NG is now in fashion. With the winter likely bringing higher usage than recent winters, purchasing an investment attached with natural gas in the October timeframe makes sense. Start watching again and put that phone down.
Read the full article here






Leave a Reply