
Thesis
Apple Inc. (NASDAQ:AAPL) stands as a globally renowned company, currently holding the title of the world’s most valuable, with Microsoft Corporation (MSFT) hot on its heels. Their innovations, including the iPhone and iPad, have left an indelible mark. In this article, I aim to elucidate why, even if China were to vanish from Apple’s revenue equation, the impact would be relatively inconsequential, resulting in only a 4.2% loss in Apple’s stock price.
Presently, the stock is aptly valued. However, should China reconsider its perplexing stance, Apple could potentially unleash an intrinsic upside of 43%. This upside might surge further as Apple transitions from being “fairly valued” to “overvalued.” Consequently, Apple represents an enticing “buy” opportunity.
Overview
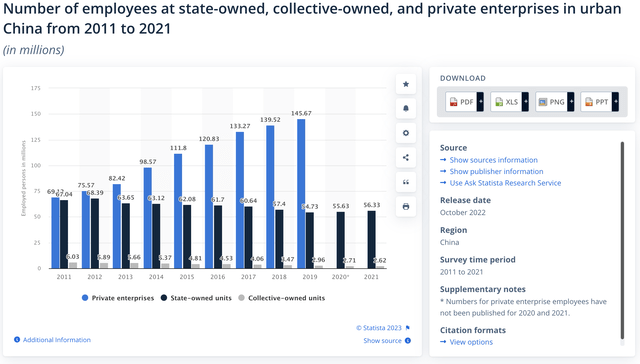
The latest news concerning Apple revolves around the release of its iPhone 15 lineup. In addition to this, a noteworthy development is the recent Chinese policy prohibiting the use of iPhones by employees of state-run enterprises. As of 2021, this policy affected a significant workforce of 56.33 million individuals, though it’s worth noting that this number is somewhat outdated. Nevertheless, there has been a discernible trend indicating a decline in the number of employees in state-run enterprises.
Staatista
Regarding the iPhone 15 line’s success, it remains challenging to make a definitive estimation. However, the prevailing consensus suggests that it is poised for success.
In essence, there isn’t much to report about Apple in terms of breaking news, given its status as one of the most renowned companies globally. The company’s founding story and the legacy of Steve Jobs are subjects widely explored in both business and computer science realms.
Now, let’s delve into the growth prospects for each of Apple’s segments. Firstly, we have the consumer electronics market, which is anticipated to exhibit a growth rate of 2.27% , as per Statista’s projections. However, an alternate perspective from Yahoo Finance suggests a potentially more robust CAGR of 5.2% spanning the years 2023 to 2033, in contrast to Statista’s forecast, which encompasses the period from 2023 to 2028.
Next, we turn our attention to Apple’s services, a substantial segment that can be further categorized into apps, repairs, and banking. The apps segment is predominantly underpinned by App Store revenue and is expected to experience growth ranging from 8.58% to 14.4%. Meanwhile, the consumer electronics repair market is forecasted to grow at a rate spanning from 3.6% to 7.7%. In the realm of banking operations, we look to the “fintech” market, where projections indicate a potential CAGR range of 9.9% to 20%, with the upper end of this range being the highest estimate sourced from Allied Market Research.
Lastly, we consider the consumer electronics accessories sector, with an estimate of a CAGR between 5.56% and 8.3%. It’s important to note that these estimates have been collated from various sources. However, for the purpose of illustrating that Apple’s reliance on China is not imperative, I will be employing the most conservative estimates, which, nonetheless, suggest that Apple’s growth potential exceeds the projections outlined in the discounted cash flow (“DCF”) models.
Financials
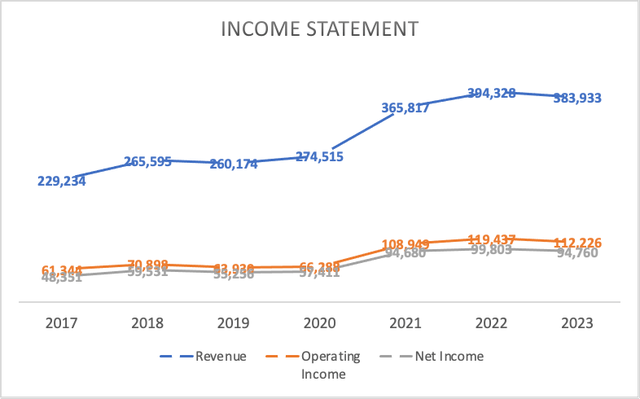
Since 2017, Apple has consistently achieved an annual revenue growth rate of 9.6%. However, when you delve into the nature of Apple’s revenue, you’ll notice a distinct seasonality, exemplified by the substantial revenue spike from 2020 to 2021. This spike can be largely attributed to government stimulus efforts aimed at mitigating potential economic fallout from the COVID-19 pandemic. Perhaps this seasonality is the impetus behind initiatives like the Vision Pro and Apple’s foray into banking, designed to mitigate the fluctuations inherent to being a consumer electronics designer by establishing recurring revenue streams.
Author’s Calculations
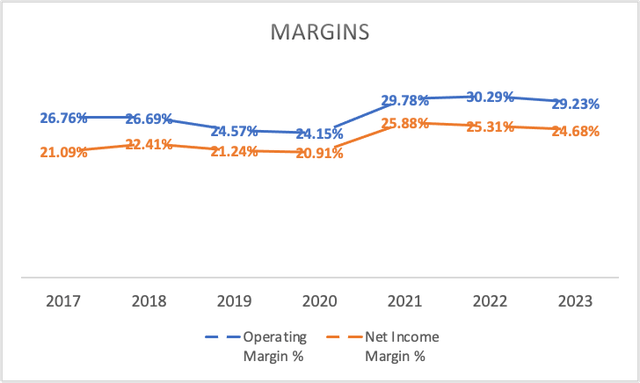
Apple’s profit margins are, needless to say, robust, boasting both operating and net income margins comfortably exceeding 20%.
Author’s Calculations
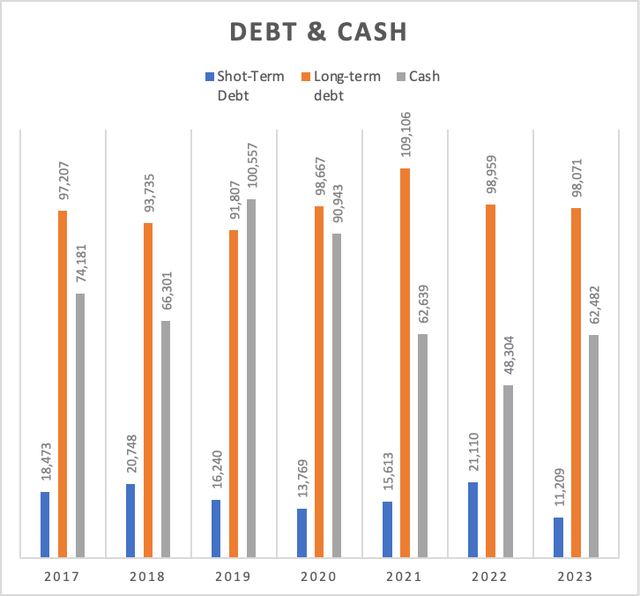
In terms of financial leverage, Apple carries a debt of $109.28 billion while maintaining a hefty cash reserve of $62.4 billion. This substantial cash reserve accounts for 57% of Apple’s debt, underscoring its solid financial position. While there are companies with more cash than debt, Apple’s financial position is undoubtedly commendable.
Author’s Calculations
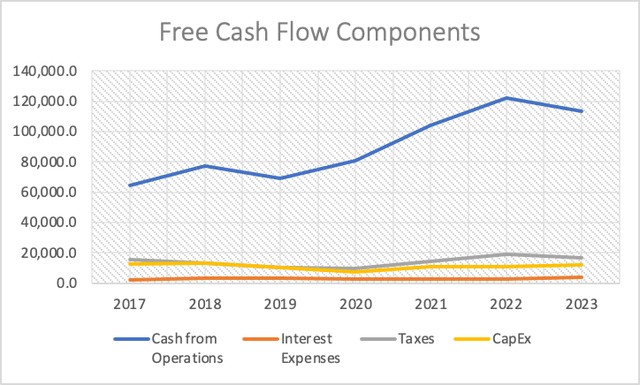
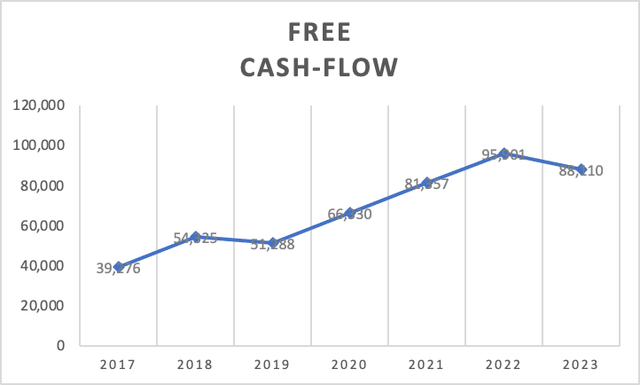
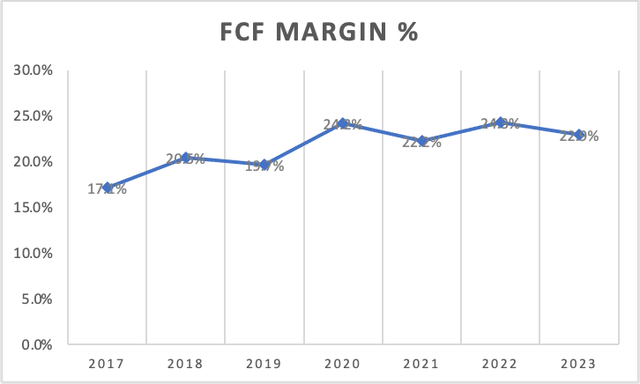
Lastly, let’s examine Apple’s free cash flow, which has seen impressive growth, primarily driven by increased cash from operations. Since 2017, Apple’s overall free cash flow has grown at an impressive annual rate of 17.76%. This growth has played a pivotal role in the remarkable ascent of Apple’s stock price. Apple’s cash flow margin, standing at 22.9%, may not place it at the pinnacle of profitability among companies, but it is undeniably robust.
Author’s Calculations
Author’s Calculations
Author’s Calculations
In summation, Apple finds itself in a robust financial position, generating substantial cash flows despite its more moderate revenue growth. This cash flow surge has been the driving force behind the company’s remarkable stock price increase, underlining its reliability as a profitable enterprise, with margins consistently exceeding 20%.
Valuation
Firstly, let’s initiate the initial valuation model under the assumption that China does not impose a comprehensive nationwide ban on iPhones. In this scenario, all operations proceed as usual, and we anticipate the following revenues for each of Apple’s operational segments:
| Sale of Consumer Electronics | Apps (Services) | Repairs (services) | Banking (Services) | Wearables,Homes and Accessories | Total | |
| 2025 | 218,805.47 | 103,648.00 | 27,905.00 | 8,696.00 | 36,923.00 | 395,977.47 |
| 2026 | 223,772.35 | 118,573.31 | 28,909.58 | 9,556.90 | 38,975.92 | 419,788.07 |
| 2027 | 228,851.99 | 135,647.87 | 29,950.32 | 10,503.04 | 41,142.98 | 446,096.20 |
| 2028 | 234,046.93 | 155,181.16 | 31,028.54 | 11,542.84 | 43,430.53 | 475,229.99 |
Next, I compile the necessary variables to compute EBITDA. This includes revenues, to which I’ve added $23 billion for projection stability. Additionally, we consider net income, calculated with a 23.08% margin, a tax rate of 14.93%, and depreciation and amortization (D&A) as well as interest expenses, both derived from revenue-based margins at 3.30% and 0.98%, respectively.
| Revenue | Net Income | Plus Taxes | Plus D&A | Plus Interest | |
| 2023 | $383,330.00 | $88,472.56 | $101,684.48 | $114,334.37 | $118,083.33 |
| 2024 | $406,060.00 | $93,718.65 | $107,713.98 | $121,113.96 | $125,085.22 |
| 2025 | $417,340.47 | $96,322.18 | $110,706.30 | $124,478.54 | $128,560.13 |
| 2026 | $441,151.07 | $101,817.67 | $117,022.45 | $131,580.44 | $135,894.89 |
| 2027 | $467,459.20 | $107,889.58 | $124,001.11 | $139,427.26 | $143,999.01 |
| 2028 | $496,592.99 | $114,613.66 | $131,729.32 | $148,116.89 | $152,973.57 |
| ^Final EBITA^ |
| D&A Projection | Interest Projection | |
| 2023 | 12,649.890 | 3,748.97 |
| 2024 | 13,399.980 | 3,971.27 |
| 2025 | 13,772.236 | 4,081.59 |
| 2026 | 14,557.985 | 4,314.46 |
| 2027 | 15,426.154 | 4,571.75 |
| 2028 | 16,387.569 | 4,856.68 |
Now, let’s examine the table of assumptions, which, in essence, contains all the current trailing twelve-month [TTM] data without any unique or noteworthy factors:
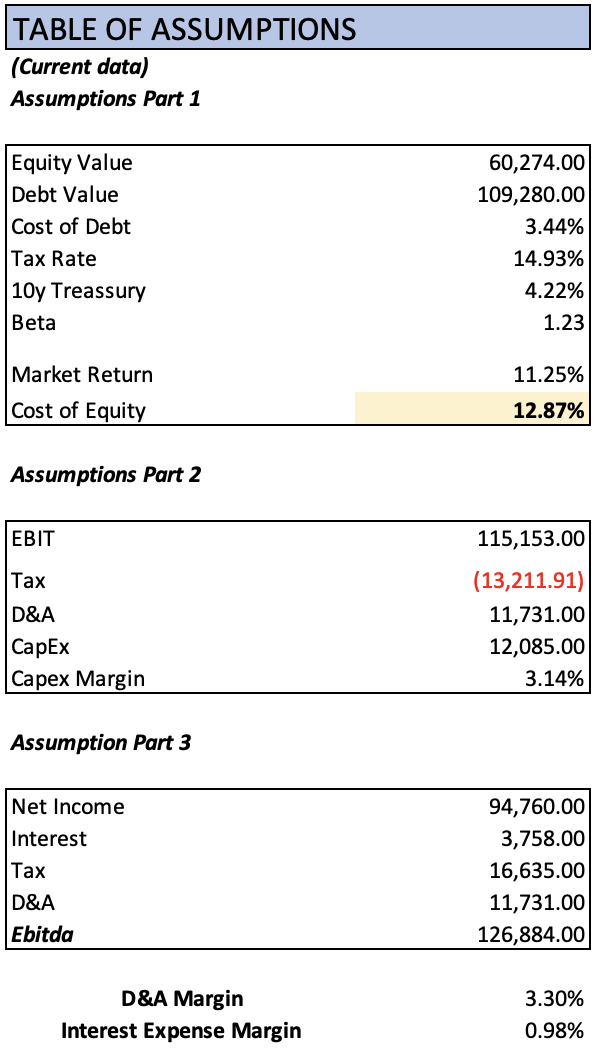
Author’s Calculations
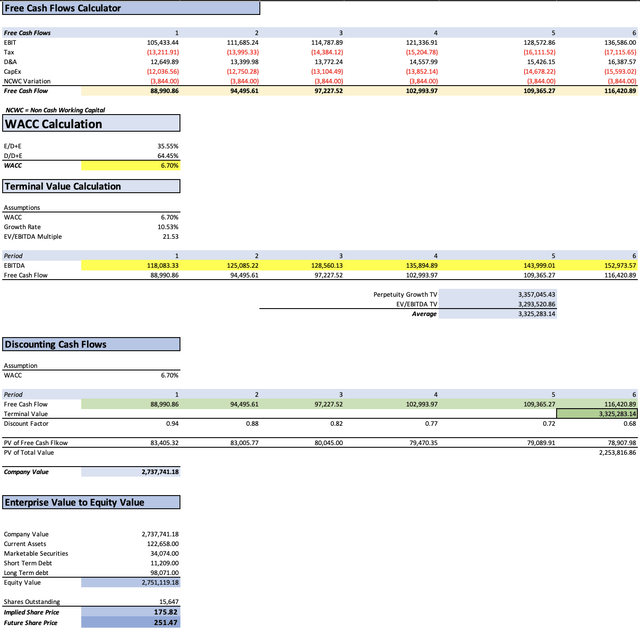
DCF 1 (Author’s Calculations)
As evident from this analysis, Apple’s fair value is assessed at $175.82, a figure remarkably close to its current stock price of $175.74. This suggests that, assuming China refrains from declaring an all-out war on Apple, the company is presently trading at a fair valuation. Looking ahead, the projected future price stands at $251.47, indicating a substantial 43% upside potential and an annual return of 8.6%.
Now, let’s delve into the second discounted cash flow [DCF] model, which posits that Apple’s stock would not face severe repercussions even in the event of China deciding to ban Apple products within its borders. It’s essential to note that, as of the latest quarter, China accounts for 19% of Apple’s total revenue. In light of this, I project that China’s ban would result in a 4.75% reduction in revenue over a four-year span, spanning from 2025 to 2028. Adhering to the same structural approach and adjusting revenues to this revised scenario, the EBITDAs manifest as follows:
| Revenue | Net Income | Plus Taxes | Plus D&A | Plus Interest | |
| 2023 | $383,330.00 | $88,472.56 | $101,684.48 | $114,334.37 | $118,083.33 |
| 2024 | $406,060.00 | $93,718.65 | $107,713.98 | $121,113.96 | $125,085.22 |
| 2025 | $398,052.62 | $91,870.54 | $105,589.89 | $118,725.63 | $122,618.58 |
| 2026 | $422,243.57 | $97,453.82 | $112,006.93 | $125,940.97 | $130,070.51 |
| 2027 | $447,402.63 | $103,260.53 | $118,680.78 | $133,445.06 | $137,820.66 |
| 2028 | $475,341.37 | $109,708.79 | $126,091.98 | $141,778.25 | $146,427.08 |
| ^Final EBITA^ |
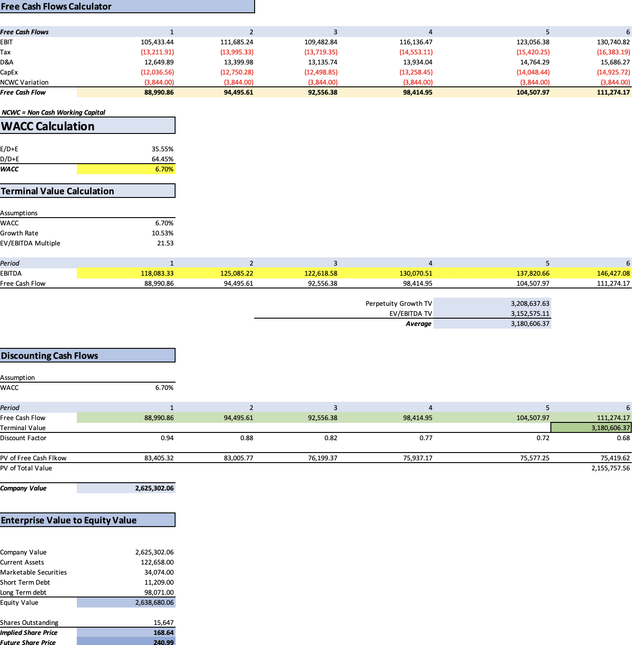
Author’s Calculations
As you can discern, the situation remains relatively stable. The current fair price stands at $168.64, indicating a modest 4.2% reduction from the current stock price. Looking ahead, the future price is estimated at $240.99, representing a respectable 37% upside potential, equivalent to an annual return of 7.35% through 2028.
Recall my earlier mention of utilizing the most conservative growth estimates? Well, should Apple manage to attain the loftiest projections, it would signify a fair price of $185.77, with a prospective future price of $266.11. This equates to an impressive annual return of 10.27%, all under the assumption that China continues to contribute to Apple’s revenue stream.
Lastly, it’s imperative to emphasize that Apple holds significant importance for China, arguably more than China represents for Apple. Apple’s operations have contributed to the creation of over 5 million jobs in China. If you multiply this by China’s GDP per capita of $12,964, it amounts to a substantial $64.8 billion in value added to the Chinese economy. Given China’s ongoing economic challenges, including declining industrial production and rising unemployment, it prompts contemplation on whether it is prudent to expel a company that played a pivotal role in China’s economic transformation.
Despite the current concerns surrounding China, I maintain a “buy” rating for Apple. These models suggest that China’s actions would not severely impact Apple’s stock price. Apple’s growth potential could even surpass these projections, with its banking operations potentially playing a pivotal role. It is imperative, however, to exercise caution and learn from the lessons of history, as exemplified by the experience of General Electric Company (GE) under the leadership of Jack Welch.
Risks to Thesis:
The primary concern for this thesis does not revolve around whether China’s impact exceeds our expectations, but rather the vulnerability of individual segments, with the most pivotal being the iPhone. If, for instance, Apple’s iPhone 15 fails to garner the anticipated level of success, it could potentially deliver a more severe blow than anything China might impose.
Additionally, there is the macroeconomic risk factor to contend with. This entails the possibility of an economic downturn, as Apple is more than just a technology company—it is, to a significant extent, a status symbol. Notably, approximately 50% of Apple’s revenue is correlated with changes in global GDP per capita.
| Advanced EconomiesGrowth | Emerging & DevelopingGrowth | Avg World GDP per CapitaGrowth % | Apple RevenueGrowth | |
| 2018 | 4.3% | 5.8% | 5.0% | 15.9% |
| 2019 | 3.1% | 4.1% | 3.6% | -2.0% |
| 2020 | -3.5% | -1.8% | -2.6% | 5.5% |
| 2021 | 10.0% | 10.9% | 10.5% | 33.3% |
| 2022 | 9.4% | 10.1% | 9.8% | 7.8% |
| 2023 | 4.7% | 6.8% | 5.7% | -2.6% |
| Correlation | 50.5% | 49.2% | 49.9% | |
| Covariance | 0.3339% | 0.3030% | 0.3184% |
In summary, Apple’s risks are more intertwined with the success of its devices than external factors like China, economic recessions, or supply chain disputes, as these issues tend to be temporary in nature. Conversely, a substantial decline in the sales of Apple’s devices could potentially result in a staggering 63% downturn.
Conclusion
In assessing Apple’s prospects in the face of China’s policies and other potential risks, it becomes evident that the tech giant’s resilience lies in its multifaceted approach to business. While China’s influence on Apple’s fortunes remains a notable concern, it is not the sole determinant of the company’s future performance. Two distinct valuation models underscore this point, revealing that even in the scenario of a significant Chinese setback, Apple’s stock remains poised for growth. The financial stability of the company, strong profit margins, and robust cash flows fortify its position as a steadfast investment choice.
Nonetheless, as we navigate these projections, it is crucial to acknowledge the pivotal role that Apple’s flagship product, the iPhone, plays in shaping its fate. The imminent success of the iPhone 15 could significantly impact Apple’s trajectory, potentially overshadowing the consequences of geopolitical events. Moreover, a deep-seated connection between Apple’s revenue and global economic conditions raises macroeconomic concerns. Apple’s status as a symbol of affluence underscores its vulnerability to economic slowdowns, as it becomes a discretionary expenditure rather than a necessity.
In this dynamic landscape, it is evident that Apple’s destiny is intrinsically tied to its device sales and innovations. While external factors like China’s policies and economic fluctuations remain noteworthy, they often represent transitory challenges. On the other hand, a substantial decline in the appeal or sales of Apple’s devices could carry a more profound and lasting impact, potentially constituting the most substantial risk to the company, with the potential for a significant market downturn. Consequently, as investors weigh the future of this tech titan, it is the performance of its devices and their reception in the market that will continue to be the primary drivers of Apple’s journey forward.
Read the full article here