First Half Update
Closing out the first half of 2024, the S&P 500 Total Return Index (which includes dividend reinvestment) is up an incredible +15.3%. For context, since 1988, the average yearly return is +11.75% and the compound annual return is +10.75%, clearly the index is having a stellar six-month performance.
Behind the scenes, AI isn’t directing the show, it is the show. To underscore just how pervasive the AI movement is in the market today, let’s start our commentary by zeroing in on Nvidia (NVDA), the AI poster child and market darling of the moment.
According to Apollo asset management, Nvidia accounted for a record-breaking 34.5% of the total return in the S&P 500 as of the middle of June; an absolutely absurd statistic when you consider that there are, as the name suggests, 500 other companies in the index.
Nvidia’s ascent from obscurity is historic, and the recent milestones of this once less-known name are remarkable. Year-to-date, the stock is up over +150%; this month, the company joined the exclusive $3 trillion market capitalization club; and a couple of weeks ago, the company even briefly stole the title of the world’s most valuable company away from Microsoft (MSFT).
The whole story is impressive, but even by financial market standards, the euphoria around the chipmaker is, for lack of a better word, unnatural. From a fundamental perspective, Nvidia’s earnings growth is equally as impressive as its stock performance (Q1-2025: +629% year-over-year), but the title of the world’s most valuable company demands something more.
To compete against the likes of Microsoft and Apple (AAPL) for the title, Nvidia has to prove the durability of its earnings, but also attain qualifications that can only come with time like an unquestioned level of maturity and pristine track record of execution.
At 1.5x the size of the entire German stock market, the company has a lot to prove. For now, granting the chipmaker the title of world’s most valuable company seems presumptuous. The situation is reminiscent of Michael Jordan being invited to play baseball for the White Sox – he was talented, but did he have what it takes to succeed in the big leagues?
Let’s talk about the rest of the market, and by “the rest of the market,” I mean Microsoft, Apple, Amazon (AMZN), Meta (Facebook) (META), Alphabet (Google) (GOOG) (GOOGL), Berkshire Hathaway (BRK.A) (BRK.B), Eli Lilly (LLY), Broadcom (AVGO) and JPMorgan (JPM).
Why these names out of a 500-company index? Well, because collectively, they now represent over 35% of the index weighting – again, another eerie record broken. The market has never in history been more concentrated in just a handful of names.
Ten years ago, the top 10, companies represented just 14% of the index, and for more context, if the S&P 500 was equal-weighted, then all ten companies would be just 2% of the index. We believe that there are two distinct dynamics at play driving this concentration to record-breaking levels.
The first we talked about already, AI. The promise of structural growth in AI is driving speculative appetites for anything and all things related to the topic, hence the big jump in Nvidia shares as well as the other mega-cap tech names in the top ten like Apple.
The second is a bit more nuanced. Today, we are likely in a recession or something that looks a heck of a lot like a recession. The indicators below are just a handful of data points that are down from their previous reading or missed analyst expectations.

The cyclical decline in the economy will impact the earnings of industries of all sizes, from Apple to your local barbershop. However, “mega-cap tech,” which is well represented in the S&P 500 top 10 is often wrongly regarded as a defensive position in the face of economic slowdowns.
Under the guise of “high-quality” – “high quality businesses” – “high quality balance sheets” and perceptions of forever earnings growth, market pundits notoriously recommend tech as a safe haven from the business cycle, but almost never talk about price.
We wholeheartedly disagree with the thought. First, all businesses are cyclical, and the only question is the level of sensitivity to the cycle. For reference, look no further than 2022. A modest ad market slowdown roiled the most beloved names during the 2020-2021 covid rally:

Then, as now, leading up to the beginning of 2022, pundits labeled these stocks as “defensive” – they turned out to be anything but. No one doubts that these companies are wonderful businesses, but those who recommended them seemingly failed to consider the price paid for “high quality.”
In this instance, and in most instances for that matter, paying for high-quality growth at any price is like getting insurance for your home that covers just half its value; you better hope that the next hurricane misses your neighborhood!
But in the meantime, as the market searches for save heavens, mega caps will provide a false sense of protection, which will fan valuations ever higher – that is until they don’t.
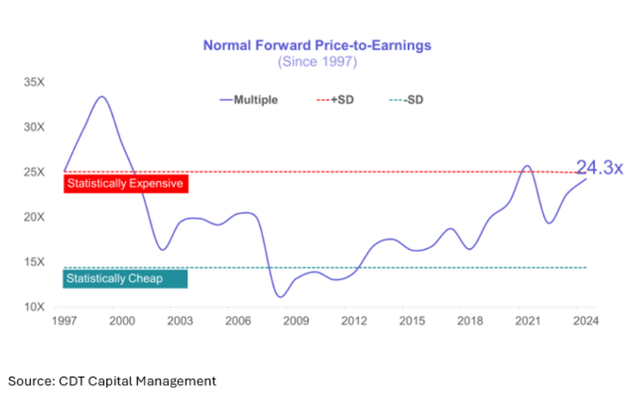
Today, according to our estimate of normal earnings growth, the market trades 1 standard deviation away from its average P/E and is getting more expensive by the day. At this valuation, this top-heavy market is not even considering the business cycle as a possibility of risk.
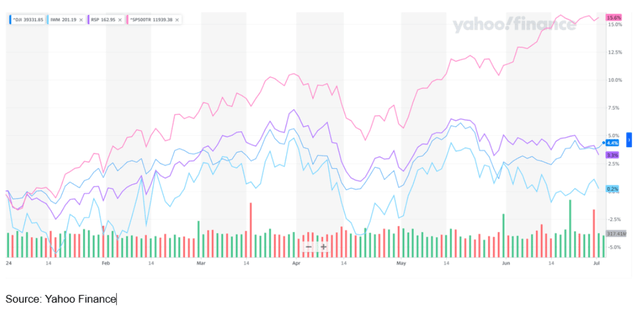
The real rest of the market, represented by the Dow Jones Industrial Average (DJI), the Russell 2000 (IWM) and the equal-weighted S&P 500 (RSP) have fared far worse than their meg-cap tech-driven S&P 500 counterpart (^SP500TR).
We feel that the relative underperformance of these indices is indicative of the rest of the market discounting the increasing likelihood of recession and the future impact on their respective earnings. Meanwhile, mega caps fueled by AI and ‘high quality’ rhetoric have not yet reflected these developments.
Quick Digression: In real-time, to underscore the dichotomy in the market between mega-cap names and their smaller counterparts, Tesla (TSLA) just reported sales production for Q2 and the numbers were down -5% on a year-over-year basis but were slightly better than analyst estimates.
The result is the stock is up approximately +10% or roughly $73B in market capitalization terms. On what is ostensibly a net negative piece of information, the market capitalization of the stock in a single day increased by more than the entire market capitalization of its competitor, General Motors (GM) by a long shot, which is utterly irrational.
As serendipity would have it, GM also reported sales volume numbers this morning that were also ahead of estimates and for added color, were the best numbers since 2020. As a result, the market has rewarded GM with a flat stock price. This story should highlight the degree of silliness that is currently gripping the market.
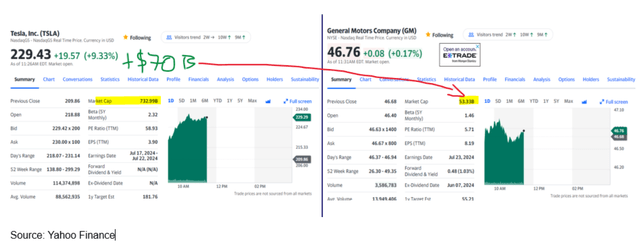
Emphasis: The one-day rate of change in Tesla stock price is more than the entire market capitalization of GM – absurd!
Disclosure: We currently hold a position in General Motors.
Above the Clouds
Okay, so let us take stock. The AI craze, particularly Nvidia, is in the driver seat of a highly concentrated and expensive stock market. Economic indicators have gone from healthy to deeply red. Gambling behavior is once again gripping the market, as evidenced by the TSLA digression we talked about earlier, but we also note that at the beginning of May, meme stocks mania made a comeback like it was 2021.
It is time to raise cash. Individually, any one of these issues could be cause for a market sell off. The concentration story that played out in 2020-2021 led to dismal results in 2022 and prior to that, the last time the market was so narrowly held was the dotcom bubble.
Further, according to RBC Capital Markets, the stock market has on average lost -32% peak-to-trough during drawdowns caused by recessions since 1937 and while, we are not in a recession today, the probability of one has certainly increased. Lastly, all manias without exception lead to a future hangover.
As a hedge fund, underwriting risk is part of our DNA. Our quantitative framework is what we leverage to draw up our flight path as we traverse all market environments including this peculiar case.
Today, we are approximately 10% reserved based on an elevated market valuation, a relatively high risk-free return on cash and a weakening labor market. For all the reasons we have already mentioned, we believe this shift from fully invested to more defensive is prudent.
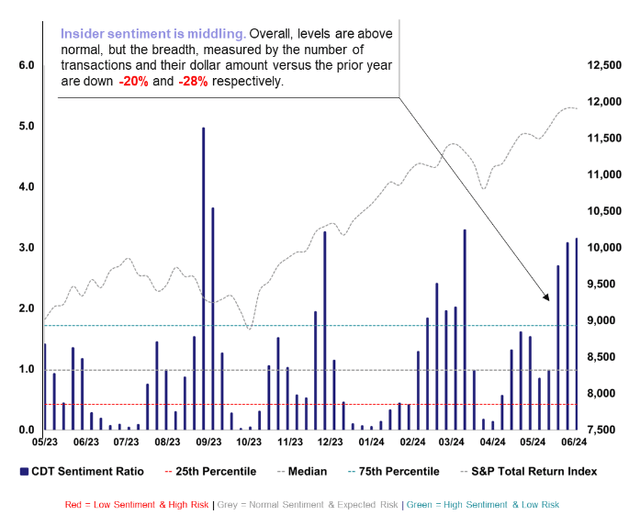
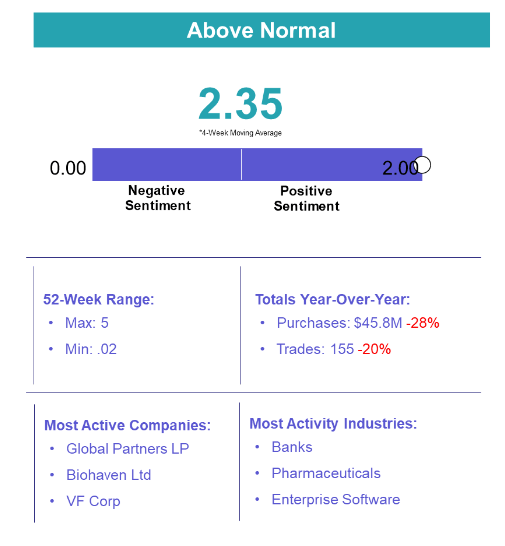
Our reserve would be higher if not for one unusual phenomenon, insider sentiment remains above normal trends. That may seem awkward given all the caution we have expressed in our note, but if you double-click on it, we believe it makes a lot of sense.
First, let’s talk about what we are not seeing, we are not seeing mega-cap tech insiders actively purchasing their shares. In fact, the opposite is true, we are frequently reading in the media that top executives at these companies are selling. While we do not believe that to be a reliable signal for gauging insider sentiment, it logically is at best a neutral indication and at worst, a warning.
Additionally, given that AI is consuming all the air in the market, it makes sense that insiders from other parts of the market that have not yet received their fair share of attention are buying their respective equities on the back of stagnant or depressed valuations, which is elevating insider sentiment outside of mega caps.
For us, as we have mentioned before and will reiterate again, where we do see activity is in three primary industries: utilities, healthcare, and banking. All three of which we would consider resilient cash flowing business models that are currently trading at very attractive valuations in relation to their respective secular growth trends. Below, we outlined our portfolio companies in each industry category and provided some quick-take bullet points on the prospects of each industry.
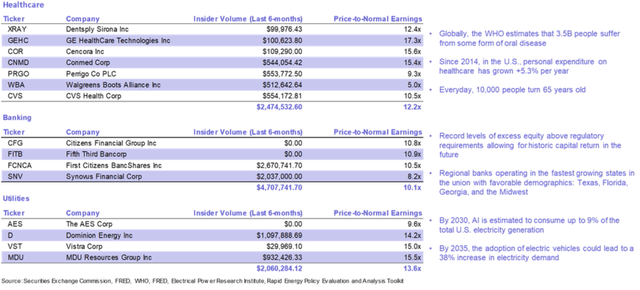
Together these companies represent approximately 3/4th of the net asset value of our stock portfolio. That is not to say that during the first half of 2024, we have not seen activity in other parts of the market, we have.
Cybersecurity, enterprise SaaS, liquified natural gas and auto part retailers are just some of the areas of the market that we observed extraordinary activity and taken a position; that is if we did not have one already.
While other companies with observed insider activity such as Zillow (Z), Edwards Lifesciences (EW), Nike (NKE) and Disney (DIS), to name a few, simply did not pass our definition of extraordinary insider activity or meet our fundamental criteria.
We look forward to updating you again in August.
How it Works
Objective: Predictive model that measures the historical relationship between insider sentiment and the future probability of downside volatility (risk)
Insider Trading Activity: Purchase activity of an insider’s own stock filtered by proprietary parameters to scrub noisy data
Insight: Executive-level insider sentiment is an indicator of near-term financial market risk
– Low executive sentiment suggests a high level of risk
– High executive sentiment suggests a low level of risk
Scale: A ratio of current insider trading activity in relation to historical patterns
– (0 to ∞) with a historical median measure of 1
– Below 1 implies an above normal level of risk
– Above 1 implies a below normal level of risk
Frequency: The measure is updated daily and has historically been subject swift and possibly extreme shifts
*This webpage is updated monthly and provides just a snapshot of the most recent month-end
Disclosures
This presentation does not constitute investment advice or a recommendation. The publisher of this report, CDT Capital Management, LLC (“CDT”) is not a registered investment advisor. Additionally, the presentation does not constitute an offer to sell nor the solicitation of an offer to buy interests in CDT’s advised fund, CDT Capital VNAV, LLC (“The Fund”) or related entities and may not be relied upon in connection with the purchase or sale of any security. Any offer or solicitation of an offer to buy an interest in the Fund or related entities will only be made by means of delivery of a detailed Term Sheet, Amended and Restated Limited Liability Company Agreement and Subscription Agreement, which collectively contain a description of the material terms (including, without limitation, risk factors, conflicts of interest and fees and charges) relating to such investment and only in those jurisdictions where permitted by applicable law. You are cautioned against using this information as the basis for making a decision to purchase any security.
Certain information, opinions and statistical data relating to the industry and general market trends and conditions contained in this presentation were obtained or derived from third-party sources believed to be reliable, but CDT or related entities make any representation that such information is accurate or complete. You should not rely on this presentation as the basis upon which to make any investment decision. To the extent that you rely on this presentation in connection with any investment decision, you do so at your own risk. This presentation does not purport to be complete on any topic addressed. The information in this presentation is provided to you as of the date(s) indicated, and CDT intends to update the information after its distribution, even in the event that the information becomes materially inaccurate. Certain information contained in this presentation includes calculations or figures that have been prepared internally and have not been audited or verified by a third party. Use of different methods for preparing, calculating or presenting information may lead to different results, and such differences may be material.
Original Post
Editor’s Note: The summary bullets for this article were chosen by Seeking Alpha editors.
Read the full article here






Leave a Reply